
NCERT Solutions Class 7 Maths Part 2 Chapter 5: Connecting the Dots…
Answers to every question in Part 2 Chapter 5, Connecting the Dots…, of Ganita Prakash Grade 7 (2026-27): the in-text questions, every Figure it Out, Try This and Math Talk question, the projects, and the number lock puzzle. The page numbers match the book (pages 97–135). Values read from the book’s graphs are estimates, so small differences in your readings are fine. Short notes: Part 2 Chapter 5 notes.
Of questions and statements (pages 97–98)
Guess each friend’s gender from heights of 5 feet and 6 feet. Most people guess that the 5-foot friend is a woman and the 6-foot friend is a man, because men are more often taller than women. The guess may be wrong; it says what is likely, not what is certain. That is statistical thinking.
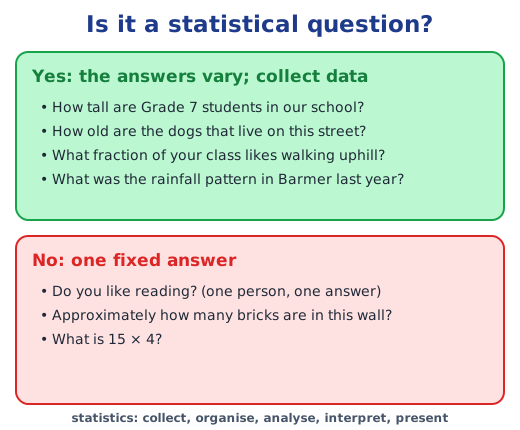
Math Talk: which are statistical questions?
- (a) The price of a tennis ball in India: statistical. Prices differ from shop to shop and brand to brand, so data is needed.
- (b) The ages of the dogs on this street: statistical. The ages differ from dog to dog.
- (c) The fraction of your class that likes walking up a hill: statistical. Every student is asked, and the answers vary.
- (d) “Do you like reading?”: not statistical. One person gives one answer.
- (e) Roughly how many bricks are in this wall: not statistical. One wall has one count, found by counting or estimating.
- (f) The question about yesterday’s top bowler: statistical. It needs every bowler’s figures, such as wickets taken and runs given, which vary.
- (g) The rainfall pattern in Barmer last year: statistical. It needs rainfall data for many days or months.
Representative values (pages 98–100)
Who performed better in the first series? Shubman scored 0, 17, 21 and 90; Yashasvi scored 67, 55, 18 and 35. Shubman made the single highest score, 90. Yashasvi made more runs in all, 175 against 128, and was steadier: his scores spread over 67 − 18 = 49 runs, Shubman’s over 90 − 0 = 90. Both batted 4 times, so the totals compare fairly, and Yashasvi did better overall.
What do you think of Vaishnavi’s statement about the second series? It is not fair. Shubman’s 110 runs came from 5 matches but Yashasvi’s 96 runs from only 4, so the totals cannot be compared directly.
Math Talk: can one number represent a group of numbers? Yes, a representative value such as the mean. Shubman: 110 ÷ 5 = 22 runs a match. Yashasvi: 96 ÷ 4 = 24 runs a match. So in this series Yashasvi performed better. (The book prints 110 ÷ 5 = 21; the correct value is 22.)
In which group does each member get a bigger share of guavas? Shreyas’s group: 3 + 8 + 10 + 5 + 4 = 30 guavas, so 30 ÷ 5 = 6 each. Parag’s group: 5 + 4 + 6 + 3 + 4 + 8 = 30 guavas, so 30 ÷ 6 = 5 each. Each member of Shreyas’s group gets one more.
Average number of hibiscus flowers a day. (2 + 7 + 9 + 4 + 3) ÷ 5 = 25 ÷ 5 = 5 flowers a day.
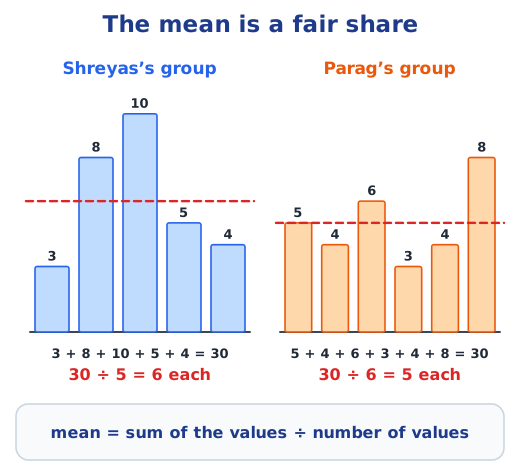
Figure it Out (page 101)
1. Shreyas’s bounces. 6 + 2 + 9 + 5 + 4 + 6 + 3 + 5 = 40 bounces in 8 attempts, so the average is 40 ÷ 8 = 5 bounces.
2. Try the activity yourself. Record at least 7 attempts, add the bounces and divide by the number of attempts. For example, 4, 7, 3, 6, 5, 8 and 2 bounces give 35 ÷ 7 = 5 bounces an attempt.
3. Flowers on a plant over a week. Count the new flowers each day for 7 days, add the counts and divide by 7. For example, 3, 5, 4, 6, 2, 5 and 3 flowers give 28 ÷ 7 = 4 flowers a day.
4. Who ran quicker on average? Nikhil: 17 + 18 + 17 + 16 + 19 + 17 + 18 = 122 s. Sunil: 20 + 18 + 18 + 17 + 16 + 16 + 17 = 122 s. Both means are 122 ÷ 7 ≈ 17.43 s, so on average neither was quicker. Nikhil was a little steadier, from 16 to 19 s, while Sunil ranged from 16 to 20 s.
5. Mean enrolment. (1555 + 1670 + 1750 + 2013 + 2040 + 2126) ÷ 6 = 11154 ÷ 6 = 1859 students.
Know your onions (pages 101–104)
Where are onions costlier, and what do you make of each claim?
- Khushboo uses only the single highest price, ₹60, and ignores the other eleven months.
- Nafisa’s totals compare fairly here, because both towns have 12 months of data: Yahapur ₹458, Wahapur ₹450.
- Vishal looks only at the high prices (Wahapur has 52, 53 and 60; Yahapur has 56 and 59) and ignores the rest.
- Sampat compares month by month: Yahapur is higher in 6 months, Wahapur in 5, and June is equal.
- Jithin’s differences, 35 and 43, show that Wahapur’s prices vary more; they do not say which town is costlier.
Taken together, onions are slightly costlier in Yahapur, as the means below confirm.
Other ways to compare the data. The mean or the median of each town, a dot plot, or a double bar graph of the months.
Does the dot plot capture all the data? All 24 prices appear as dots, so no value is lost, but the months are not shown. Can you tell Yahapur’s January price from it? No. A dot plot sorts the values and loses their order.
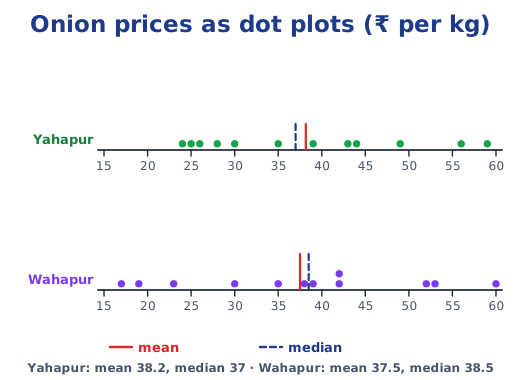
Average price of onions. Yahapur: 458 ÷ 12 ≈ ₹38.17 a kg. Wahapur: 450 ÷ 12 = ₹37.50 a kg. On average onions cost slightly more in Yahapur.
Math Talk: what else do you wonder about? Open questions, for example: Why do both towns peak in October and November? Are the towns close together? Do the rains or the harvest season change the price?
Outliers and medians (pages 105–109)
Average height of each family; is Yaangba’s family taller? Yaangba’s family: 986 ÷ 6 ≈ 164.3 cm. Poovizhi’s family: 801 ÷ 5 = 160.2 cm. We cannot say that Yaangba’s family is taller. Four of Poovizhi’s five family members are taller than 164.3 cm; their mean is low only because of one young child.
Does the median represent the heights better? Yes, for Poovizhi’s family. Sorted, 118, 165, 170, 173, 175 has median 170 cm, close to most of the family. Yaangba’s family, 155, 160, 164, 165, 169, 173, has median (164 + 165) ÷ 2 = 164.5 cm, almost equal to its mean.
Poovizhi’s data without 118. Mean 683 ÷ 4 = 170.75 cm; median (170 + 173) ÷ 2 = 171.5 cm. The mean rises by more than 10 cm but the median by only 1.5 cm, so the outlier had affected mainly the mean.
Short stories read: guess first, then find the mean and the median. One student read 40, so expect the mean to be greater than the median. The 15 values are 6, 3, 0, 8, 2, 5, 15, 7, 12, 10, 40, 5, 0, 1 and 8, with a sum of 122, so the mean is 122 ÷ 15 ≈ 8.13. Sorted: 0, 0, 1, 2, 3, 5, 5, 6, 7, 8, 8, 10, 12, 15, 40. The 8th value, 6, is the median.
Which value is an outlier? 40. Without it, the mean is 82 ÷ 14 ≈ 5.86 and the median is (5 + 6) ÷ 2 = 5.5. The mean fell by more than 2, the median by only 0.5.
Newspaper pages, Monday to Sunday. 16 + 18 + 20 + 22 + 26 + 16 + 10 = 128, so the mean is 128 ÷ 7 ≈ 18.29. Sorted: 10, 16, 16, 18, 20, 22, 26, so the median is 18.
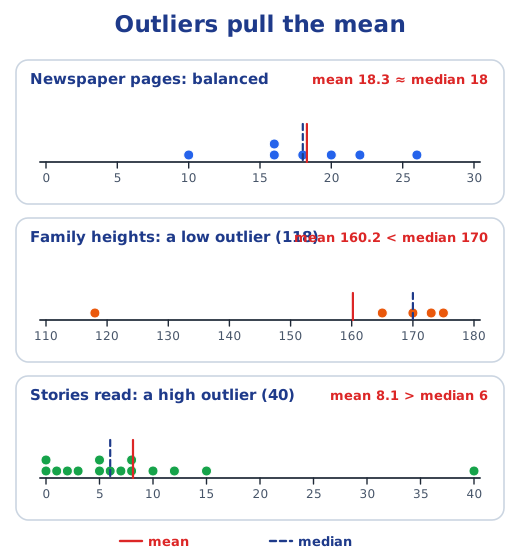
Math Talk: match each case to an example. (a) Mean and median close: newspaper pages, 18.29 and 18. (b) Mean < median: Poovizhi’s family heights, 160.2 < 170. (c) Mean > median: short stories, 8.13 > 6.
Math Talk: outliers on both sides. Take 20, 21, 22 and 23, with mean and median 21.5. Add a low outlier 1 and a high outlier 50: the data 1, 20, 21, 22, 23, 50 has mean 137 ÷ 6 ≈ 22.83 and median (21 + 22) ÷ 2 = 21.5. The median does not move. The two outliers pull the mean in opposite directions and partly cancel, and the mean shifts towards the one that is farther away (50 is 28.5 above, 1 is 20.5 below). If they are equally far, as with 0 and 43, the mean stays at 21.5.
Of ends and the essence (pages 109–110)
How tall is your class? Give a central value and the spread: the mean and the median, the shortest and tallest heights, and if possible a dot plot. For the Grade 5 class in the book: “The class is about 145 cm tall on average, from 128 cm to 158 cm.”
How many students are taller than the class’s average height? The 28 heights add up to 4046 cm, so the class mean is about 144.5 cm (the book shows 144.4). 15 students are taller. How many boys? 8 of them: 145, 146, 146, 147, 150, 154, 155 and 158 cm. The other 7 are girls.
How long is a minute? Compare the two groups. Both groups centre close to 60 s. Group A has mean 58.21 s and median 60 s; its mean sits below the median because a few children opened their eyes very early, in the low 40s. Group B has mean 59.28 s and median 59.5 s, almost equal, and its values crowd more tightly around 58–61 s. Both spread over about 25 seconds (Group A from about 42 to 68 s, Group B from about 47 to 71 s), so many children were 10 seconds or more away from a minute. Group B did slightly better.
Zero median runs (page 111)
Can the median runs per batter be 0 when the team scored 407/10? Yes. England’s eleven batters scored 19, 0, 0, 22, 158, 0, 184, 5, 0, 0 and 0, which is 388 runs, and extras added 19 to make 407. Sorted: 0, 0, 0, 0, 0, 0, 5, 19, 22, 158, 184. The 6th value is 0, so the median is 0. The mean is (407 − 19) ÷ 11 ≈ 35.27 runs, carried by two huge innings.
Zero or no value. The player did not bat in Match 5, so divide by 6: (57 + 13 + 0 + 84 + 51 + 27) ÷ 6 = 232 ÷ 6 ≈ 38.67 runs a match.
Sita’s mangoes. Use only the season, March to July: 8, 24, 41, 16 and 5. The mean is 94 ÷ 5 = 18.8 mangoes a month, and the median of 5, 8, 16, 24, 41 is 16.
Figure it Out (pages 112–113)
1. Median onion prices. Yahapur sorted: 24, 25, 26, 28, 30, 35, 39, 43, 44, 49, 56, 59, so the median is (35 + 39) ÷ 2 = ₹37. Wahapur sorted: 17, 19, 23, 30, 35, 38, 39, 42, 42, 52, 53, 60, so the median is (38 + 39) ÷ 2 = ₹38.5. By the median Wahapur is a little higher, by the mean Yahapur; the two towns are very close.
2. Pets and domestic animals. The two absent students give no value, so there are 20 values with a sum of 72. Mean 72 ÷ 20 = 3.6. Sorted: 0, 0, 0, 0, 0, 0, 1, 1, 1, 2, 2, 2, 3, 4, 4, 4, 5, 8, 10, 25, so the median is (2 + 2) ÷ 2 = 2. Most students have between 0 and 5 animals, and 6 have none. The value 25 is a high outlier, and 8 and 10 are high too, so the mean sits well above the median; the median, 2, is the more typical value.
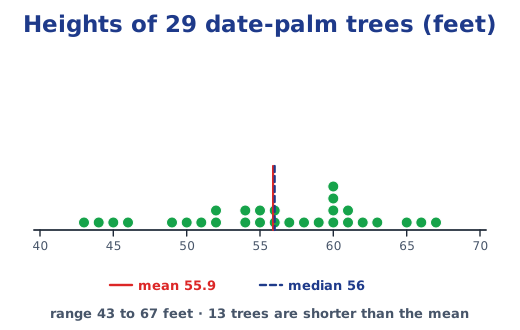
3. Rintu’s date palms. The 29 heights add up to 1621 ft, so the mean is 1621 ÷ 29 ≈ 55.9 ft. Sorted, the 15th value is 56 ft, the median. The trees range from 43 to 67 ft, most are between 50 and 62 ft, and four are exactly 60 ft. The mean and the median almost agree, so there is no strong outlier. A quicker way to the mean: subtract 50 from every height, add the differences (171), divide by 29 (about 5.9) and add 50 back. Grouping equal values, such as 60 × 4, also saves time. 13 trees are shorter than the mean: 43, 44, 45, 46, 49, 50, 51, 52, 52, 54, 54, 55 and 55 ft.
4. Daily water usage. (a) No. Every value lies between 3.09 L and 20.5 L. The mean (87.39 ÷ 9 ≈ 9.71 L) and the median (8 L, the 5th of the sorted values) must lie inside that range, so neither can be between 25 and 30 L. (b) No. The mean levels the high and low values to a common value between them, and the median is a middle value of the sorted data, so both always lie between the minimum and the maximum. They can equal the minimum only if all the values are equal.
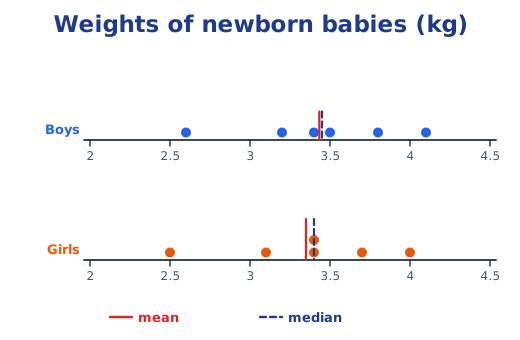
5. Newborn weights. Boys: 2.6 to 4.1 kg, mean 20.6 ÷ 6 ≈ 3.43 kg, median (3.4 + 3.5) ÷ 2 = 3.45 kg. Girls: 2.5 to 4.0 kg, mean 20.1 ÷ 6 = 3.35 kg, median (3.4 + 3.4) ÷ 2 = 3.4 kg. Both groups spread over 1.5 kg and cluster between 3 and 4 kg. These boys are slightly heavier on average, but six babies in each group are far too few to generalise from.
6. Another Grade 5 section. The boys’ heights run from about 130 to 148 cm and bunch around 143–146 cm (mean 142.05, median 143). The girls’ heights are more spread out, from about 126 to 158 cm (mean 140.14, median 140). The whole class has mean 141.21 cm and median 142.5 cm. In this section the boys are taller on average, while in the first section the girls were (146.9 against 142.94). Comparing the sections: the first section is taller overall (mean 144.4 against 141.21 cm, median 145 against 142.5 cm). Since the boy–girl result flips between two classes of one school, one class cannot tell us whether boys or girls are taller in general.
7. Sumo wrestlers and ballet dancers. Sumo wrestlers: 1201.9 ÷ 5 ≈ 240.4 kg. Ballet dancers: 254.5 ÷ 6 ≈ 42.4 kg. Since 240.4 ÷ 42.4 ≈ 5.7, a sumo wrestler is about 6 times as heavy as a ballet dancer.
Visualising data (pages 114–115)
Does the table match the graph? Yes. Every pair of bars matches the table, for example 25 and 19 in January, and 35 for both towns in June.
What is the scale? 1 unit = ₹10.
Is it easier to compare month-wise prices? Yes. The two prices for each month stand side by side, so the taller bar shows the costlier town at once.
Take off! (pages 115–118)
Your observations, and the countries. SpaceX and United Launch Alliance are from the USA; Rocket Lab is a US company that launches mainly from New Zealand. CASC, Galactic Energy and Expace are from China, Roscosmos is Russian, Arianespace is French (European) and ISRO is Indian. SpaceX launches by far the most and grows the fastest.
Which statements can be justified? The values are read with 1 unit = 20 rockets, so they are estimates.
- (a) No. Arianespace launched fewer every year, and United Launch Alliance fewer in 2023.
- (b) Yes. Only SpaceX, from the USA, passes 50 (about 61 in 2022 and 96 in 2023); CASC peaks at about 48.
- (c) Yes. Arianespace launched about 15 + 6 + 3 = 24, which is less than 40.
- (d) Yes. CASC launched about 48, 35 and 45, a mean of about 128 ÷ 3 ≈ 43, around 40.
- (e) Yes. ISRO launched about 2 + 5 + 7 = 14, Galactic Energy about 1 + 2 + 7 = 10.
- (f) No. Roscosmos launched about 16 + 21 + 18 = 55, which is less than 60.
Which organisations launched more rockets every year? SpaceX, ISRO and Galactic Energy. Rocket Lab and Expace stayed level from 2021 to 2022 and then rose.
Total launches in 2023. About 96 + 45 + 18 + 3 + 9 + 3 + 7 + 7 + 6 + 26 ≈ 220, so (b) 200 to 400.
What are you curious about? Open questions, for example: Why does the USA launch so many rockets? What did the rockets carry? What happened in 2024?
Summer and winter at the same time (pages 118–121)
What might the data be about? The hours of daylight in each month. City 1 gets the most in June and City 2 in December, which points to opposite hemispheres: City 1 is Helsinki and City 2 is Wellington.
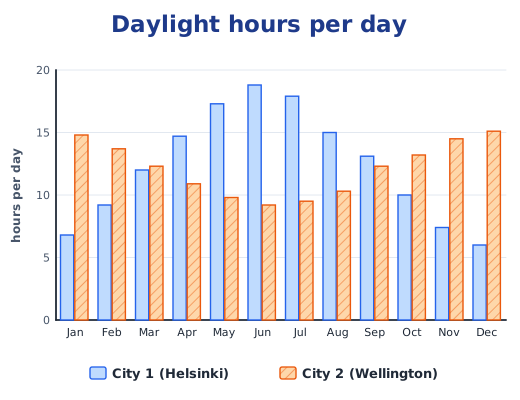
Math Talk: anything more to explore? For example, the midnight sun near the poles, how daylight changes over the year in your own town, or why places near the Equator get about 12 hours of daylight all year (Extra).
All it takes is a minute (pages 121–122)
1. Who batted first? Who won the match? The blue innings runs the full 20 overs, while the red innings stops after 18 overs without losing a wicket. A team batting second stops as soon as it passes the target, so the usual reading is that blue batted first and red chased and won. But adding the bars as drawn gives blue about 163 runs and red only about 152, which would not pass the target. So the graph alone cannot settle who won; perhaps the match was shortened, for example by rain.
2. Blue team’s runs in over 12. 15 runs.
3. Red team’s fewest runs. Over 4, about 2 runs.
4. Is the target easy to tell? No. The graph shows runs per over, not totals, so you must add all 20 blue bars: about 163 runs, which would make the target 164.
Figure it Out (pages 122–125)
1. Animal speeds. Yes, it is a bar graph: each animal has a bar of the same width whose length shows its top speed on a common scale, and the colours mark air, land and water. (a) The scale is one gridline = 16 kph, about 10 miles per hour. (b) Open: for example, the peregrine falcon’s dive at 322 kph, or the tiger beetle running blind at 8 kph. (c) Pairs where one is about twice the other: sailfish (109 kph) and flying fish (56 kph), spine-tailed swift (170) and pronghorn antelope (88), and peregrine falcon (322) and swift (170). (d) 109 ÷ 26 ≈ 4.2, so yes, a sailfish is about 4 times as fast as a humpback whale. No, we cannot call the sailfish the fastest aquatic animal in the world: the graph shows only five water animals.
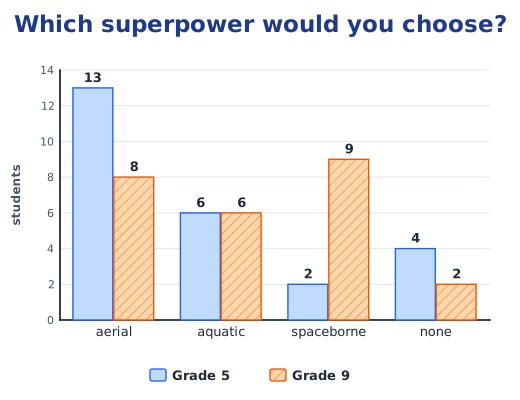
2. Superpower survey. Counting the letters (25 students in each grade):
| Choice | Grade 5, Grade 9 |
|---|---|
| Aerial (a) | 13, 8 |
| Aquatic (w) | 6, 6 |
| Spaceborne (s) | 2, 9 |
| None (n) | 4, 2 |
With 1 unit = 2 students, aerial is the favourite in Grade 5 and spaceborne in Grade 9, aquatic is equally liked, and fewer Grade 9 students chose none.
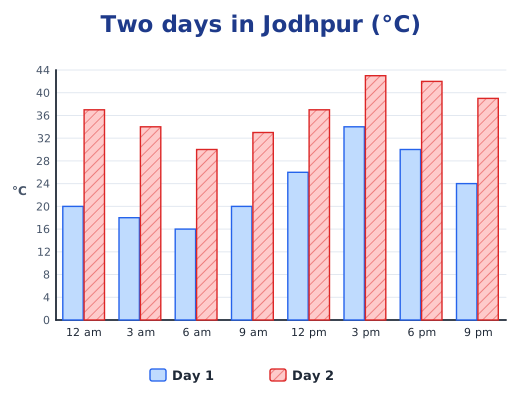
3. Jodhpur temperatures. With 1 unit = 4 °C, Day 1 runs from 16 to 34 °C and Day 2 from 30 to 43 °C; both are coolest around 6 am and hottest around 3 pm. Day 1, with cool mornings and warm afternoons, could be in March (or November). Day 2, above 40 °C in the afternoon, is likely in May or June, Jodhpur’s hottest months.
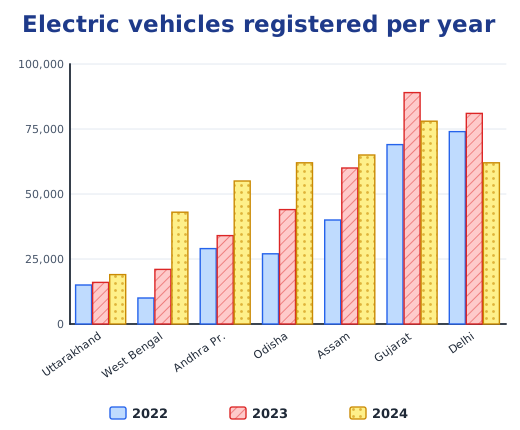
4. Electric vehicles. (a) Gujarat’s bars reach 69,000, 89,000 and 78,000, and Delhi’s 74,000, 81,000 and 62,000, as in the graph below. (b) The states are along the horizontal line, each with three bars for 2022, 2023 and 2024 in different colours, and the scale is 1 unit = 25,000 vehicles. (c) Uttarakhand rose slowly; West Bengal, Andhra Pradesh, Odisha and Assam rose every year, West Bengal the fastest; Gujarat rose in 2023 and fell in 2024; Delhi rose in 2023 and fell sharply in 2024. (d) Assam: about 60,000 − 40,000 = 20,000 more. (e) West Bengal: about 10,000 in 2022 to 43,000 in 2024, roughly 4 times. (f) No. Each bar is the number registered in that year, not a running total. Uttarakhand registered about 16,000 vehicles in 2023 and 19,000 in 2024, which is not few; the small change in bar length only means the yearly number stayed about the same.
Data detective (pages 125–129)
Telling tall tales: what do you notice? The mean heights in the dot plots are:
| Grade and school | Boys, girls (cm) |
|---|---|
| Grade 6, School A | 134.8, 137.78 |
| Grade 6, School B | 149.84, 150.2 |
| Grade 7, School A | 141.8, 141.83 |
| Grade 7, School B | 156.14, 155.41 |
| Grade 8, School A | 149.35, 147.81 |
| Grade 8, School B | 156.14, 156.83 |
School B’s students are 7 to 15 cm taller than School A’s in every grade. In School A heights rise grade by grade, while School B’s Grade 7 and Grade 8 boys’ plots are identical (both with mean 156.14), which looks like a plot printed twice. Boys and girls of the same grade are close, with sometimes one ahead and sometimes the other.
Which statements can be justified using the table?
- Yes, comparing 1989 with 2019: at every age, both boys and girls were taller in 2019. It did not happen every decade, though; a few ages dipped by 0.1–0.2 cm from 1989 to 1999.
- No. 13-year-old girls in 1989 averaged 143.2 cm, less than the 148 cm of 14-year-old girls in 2009.
- Yes, just: 15-year-old boys in 2019 averaged 159 cm, against 158.9 cm for 16-year-old boys in 1989.
- Cannot be justified. The table gives averages, which say nothing about every single girl.
- No. At ages 11 and 12, girls are taller on average in every survey year, for example 138.6 cm against 137 cm at age 11 in 2019.
- Cannot be justified. The table stops at 19. In 2019 boys grew only 0.5 cm from 18 to 19, so growth is slowing.
In 2019, when did children grow the most? Boys between ages 12 and 13, from 142.2 to 148.4 cm (6.2 cm). Girls between ages 10 and 11, from 132.8 to 138.6 cm (5.8 cm).
Estimate the heights at ages 1 to 4 if newborns average 50 cm. Five-year-olds averaged about 107 cm in 2019, so a steady climb from 50 cm adds about (107 − 50) ÷ 5 ≈ 11.4 cm a year: about 61, 73, 84 and 96 cm at ages 1, 2, 3 and 4. (Extra: babies grow fastest in their first year, so real averages are nearer 75, 86, 95 and 102 cm.)
Estimate the heights in 2029. Assume each age grows by the same amount from 2019 to 2029 as from 2009 to 2019, that is, add the 2009-to-2019 change to the 2019 value:
| Age | Boys, girls in 2029 (cm) |
|---|---|
| 5 | 109.1, 110.4 |
| 6 | 115.2, 116.1 |
| 7 | 121.0, 121.2 |
| 8 | 126.1, 125.8 |
| 9 | 131.0, 130.7 |
| 10 | 135.8, 135.7 |
| 11 | 140.3, 141.5 |
| 12 | 145.5, 146.5 |
| 13 | 151.6, 150.3 |
| 14 | 157.3, 152.8 |
| 15 | 161.7, 154.7 |
| 16 | 164.7, 156.0 |
| 17 | 166.6, 156.8 |
| 18 | 167.7, 157.4 |
| 19 | 167.9, 157.4 |
How is the countries graph organised? What do you find interesting? Countries run along the bottom from the shortest, Timor-Leste, to the tallest, the Netherlands. Each has four marks: boys (×) and girls (▲) in 1989 and in 2019. The vertical line starts at 145 cm, which zooms in on the differences. In most countries the 2019 marks sit above the 1989 ones, boys are about 10 to 15 cm taller than girls everywhere, and India’s 19-year-olds are among the shorter groups shown.
A mean decision. A door built to the family’s average height would be too low for its taller members. A door has to suit the tallest person, which is a case where the average is the wrong number to use.
Figure it Out (pages 129–134)
1. Pockets. Boys (12 children): 3 pockets (1), 4 (4), 5 (5), 6 (2), so the mean is 56 ÷ 12 ≈ 4.67, the median 5 and the range 3 to 6. Girls (13 children): 0 (1), 2 (1), 3 (4), 4 (5), 5 (1), 6 (1), so the mean is 45 ÷ 13 ≈ 3.46, the median 4 and the range 0 to 6. (a) False: the girls’ data varies more. (b) True: 5 > 4. (c) False: 3.46 < 4.67. (d) False: both maximums are 6. Only (b) is true.
2. Points per game. (a) A: (14 + 16 + 10 + 10) ÷ 4 = 12.5 points. (b) Divide C’s total by 3, because C did not play one game: (8 + 11 + 13) ÷ 3 ≈ 10.67. Divide B’s total by 4, because B played all four games and 0 is a real score: 18 ÷ 4 = 4.5. (c) A performed most strongly, with the highest mean and steady scores.
3. General knowledge quiz. First group (10 students): sum 730, mean 73, median (76 + 81) ÷ 2 = 78.5, range 39 to 95. Second group (9 students): sum 681, mean ≈ 75.67, median 79, range 47 to 93. The second group did slightly better on both measures. In the first group, the low scores 39 and 48 pull the mean well below the median.
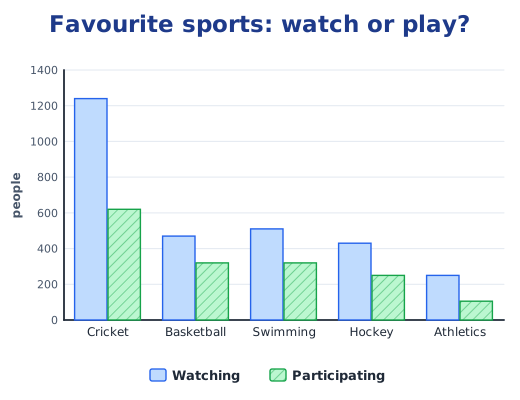
4. Favourite sports. With 1 unit = 200 people, the double bar graph shows that in every sport more people watch than play. Cricket is the most watched (1240) and the most played (620, exactly half its watchers), athletics the least of both, and basketball and swimming have the same number of players (320).
5. Dividing 17 students into two equal groups. Sorted: 101, 102, 106, 109, 110, 110, 112, 115, 115, 115, 115, 115, 117, 120, 120, 123, 125. Use the median: the 9th student, at 115 cm, is the dividing height. The 8 students before them form the shorter group and the 8 after them the taller group, with the median student left between. Five students measure 115 cm, so measure them more precisely, in millimetres, to decide their order. The mean height is 1930 ÷ 17 ≈ 113.5 cm. In the 2019 table, 6-year-olds average about 113 cm and 7-year-olds about 118 cm, so these students are probably about 6 years old.
6. Your own class. Measure everyone, sort the heights, find the mean and the median, draw a dot plot, and describe the shortest, the tallest and where the heights cluster.
7. Two sections. (d): the mean height of one section says nothing about the other section’s mean.
8. Standing tall in the storm. (a) Using the labelled bars as a guide (Hong Kong 553, Shenzhen 367, Dubai 251): New York about 315, Tokyo about 165, London about 30 skyscrapers. (b) (i) Valid. The chart lists the cities with the most skyscrapers, and 12 of them have more than Mumbai’s 86; any city not on the chart has fewer even than London. (ii) Not valid. Only 7 cities on the chart have fewer than Mumbai, but every city in the world not on the chart also has fewer. (iii) Not valid. The chart counts buildings taller than 150 m in each city; it does not show which single building is tallest. (Extra: the tallest building, the Burj Khalifa, is in Dubai.)
9. Estimate, then measure. For each object, write your estimate, then measure it and find the positive difference. For example, estimates of 15, 5, 17, 18 and 25 cm against measures of 14.2, 4.4, 18.1, 17.5 and 27.9 cm give differences of 0.8, 0.6, 1.1, 0.5 and 2.9 cm, an average difference of 5.9 ÷ 5 = 1.18 cm. Draw a double bar graph with the estimate and the measure side by side for each object.
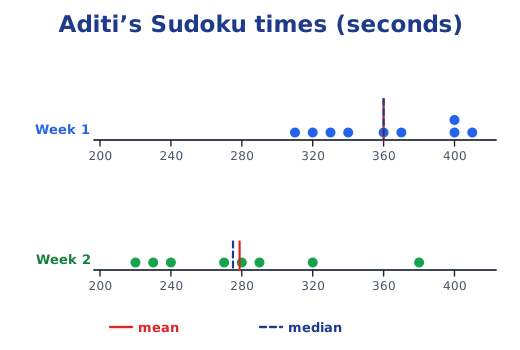
10. Aditi’s Sudoku times. Week 1 (9 puzzles): mean 3240 ÷ 9 = 360 s, median 360 s, range 310 to 410 s. Week 2 (8 puzzles): mean 2230 ÷ 8 = 278.75 s, median (270 + 280) ÷ 2 = 275 s, range 220 to 380 s. She got faster: six of her eight Week 2 times beat every Week 1 time. The 380 s in Week 2 is unusually slow, perhaps a harder puzzle, and lifts the Week 2 mean above its median.
11 to 13. Projects. These need your own data. For each one, collect the data carefully, find the minimum, maximum, mean and median, draw a dot plot or a double bar graph, and write two or three observations. For the names project, the median starting letter shows whether more names start with A to M or with N to Z. For the one-minute and three-minute estimates, compare each family’s mean with 60 s and 180 s.
Puzzle time: connect the dots (page 135)
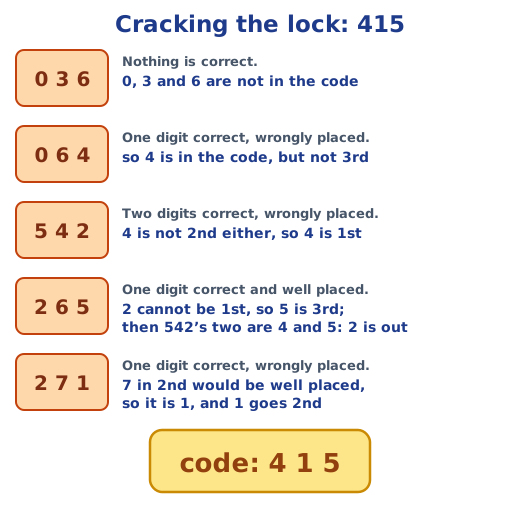
The number lock. The code is 415. From 036, none of 0, 3 and 6 is in the code. From 064, 4 is in the code but not third, and from 542 it is not second either, so 4 is first. In 265 one digit is right and well placed; 2 cannot be first, so 5 is third. That makes 4 and 5 the two right digits of 542, so 2 is out. In 271 one digit is right but wrongly placed: 7 in the middle would be well placed, so the digit is 1, and it goes in the middle.
Practice
-
What is the mean of 12, 15, 9 and 20?
Show answer
Answer: (b) 14 12 + 15 + 9 + 20 = 56, and 56 ÷ 4 = 14.
-
What is the median of 25, 31, 18, 40, 22 and 35?
Show answer
Answer: (a) 28 Sorted: 18, 22, 25, 31, 35, 40. The middle two are 25 and 31, so the median is 56 ÷ 2 = 28.
-
For the data 5, 6, 7, 6 and 50, which is true?
Show answer
Answer: (c) mean > median The mean is 74 ÷ 5 = 14.8 and the median is 6. The high outlier 50 lifts the mean.
-
A double bar graph uses the scale 1 unit = 25 students. How long is the bar for 150 students?
Show answer
Answer: 150 ÷ 25 = 6, so the bar is 6 units long.
-
A shop sold 12, 0, 18, 15 and 10 kites on five days and was shut on a sixth day. What is the mean number of kites sold per day it was open?
Show answer
Answer: The 0 counts, because the shop was open that day, but the day it was shut does not: (12 + 0 + 18 + 15 + 10) ÷ 5 = 55 ÷ 5 = 11 kites a day.
Stuck on a question?
Take a photo and Lagnever AI explains it step by step. Try it for 7 days for ₹2.
Get it on Google Play Open in browser
For parents: after the trial, the plan renews monthly by UPI or card autopay. You can cancel anytime in the app.