
Class 7 Maths Part 2 Chapter 5: Connecting the Dots… Notes
This chapter in five lines
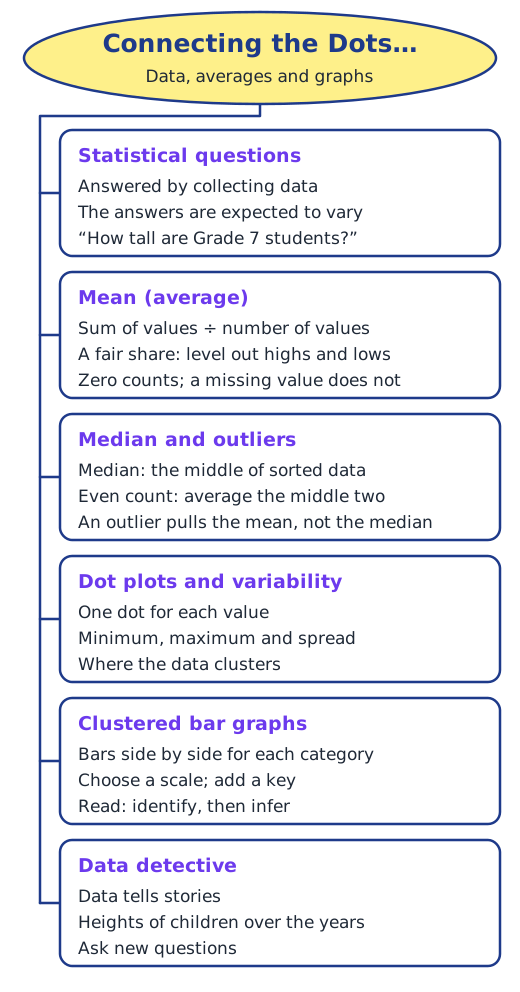
Connecting the Dots… is the statistics chapter. It shows how to ask questions that data can answer and how to sum up a group of values with one number: the mean shares the total out equally, and the median is the middle of the sorted values. Dot plots show how data spreads, and clustered bar graphs compare groups side by side.
What is this chapter about?
Your teacher is meeting two old friends, one 5 feet tall and one 6 feet tall, and you are asked to guess which is a man and which is a woman. You cannot be sure, but experience says tall women and short men are less common, so most people guess the same way. That is statistical thinking: using data to say what is likely, not what is certain. This chapter is about asking questions that data can answer, choosing one number to represent a group of numbers, and drawing data so that its story shows.
Statistical questions
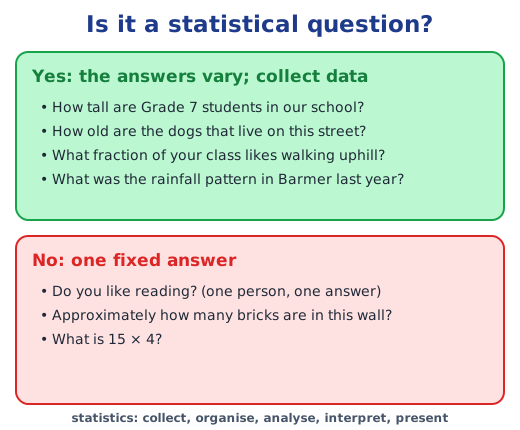
A statistical question is one you answer by collecting data while expecting the answers to differ. “How tall are Grade 7 students in our school?” is statistical, because heights change from student to student. “What is 15 × 4?” is not; it has one fixed answer. Statistics is the subject of collecting data, organising and analysing it, and interpreting and presenting what it shows.
The mean: a fair share
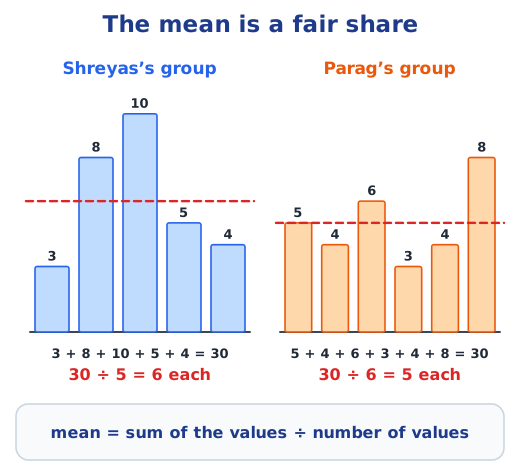
In one series Shubman made 110 runs in 5 matches and Yashasvi made 96 runs in 4, so comparing totals is unfair. Divide each total by the number of matches: 110 ÷ 5 = 22 and 96 ÷ 4 = 24, so Yashasvi scored more per match. (The book prints 110 ÷ 5 = 21; the right value is 22, and the conclusion stays the same.) This arithmetic mean, or average, is the sum of the values divided by how many values there are. It is also a fair share: if Shreyas’s group of 5 pools 30 guavas and shares them equally, each gets 6. A 0 is a real value and counts, but a missing value, such as a match not played, is left out. Read more in mean and representative values.
The median and outliers
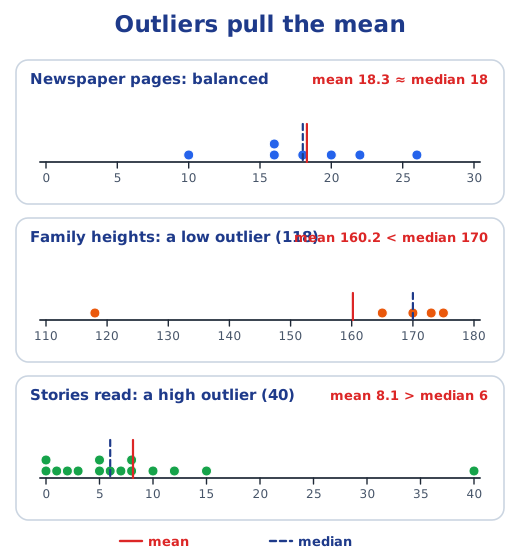
Poovizhi’s family heights are 170, 173, 165, 118 and 175 cm. Their mean, 160.2 cm, falls below four of the five heights, because the young child’s 118 cm drags it down. A value so far from the rest is an outlier. The median, the middle of the sorted values, is 170 cm and describes the family much better. With an even number of values, average the two middle ones to get the median. The mean and the median are called measures of central tendency, since they show where the values pile up. See median and outliers.
Dot plots and spread
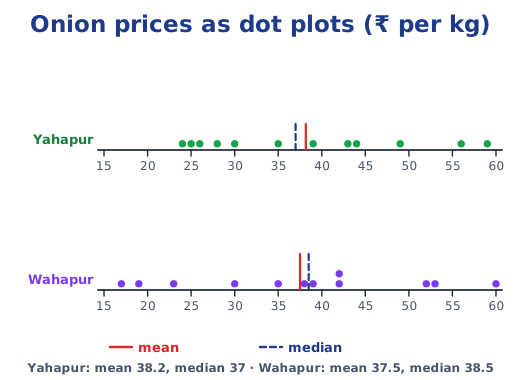
A dot plot puts one dot for each value above a number line. It loses the original order, so you cannot read January’s onion price from it, but it shows at a glance the smallest value, the largest value and where the values crowd together. On the onion dot plots, Wahapur’s prices, from ₹17 to ₹60, spread wider than Yahapur’s, from ₹24 to ₹59.
Clustered bar graphs
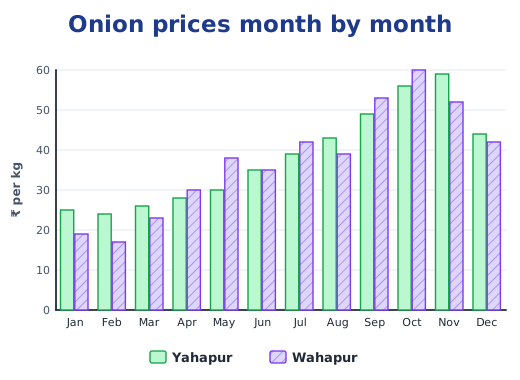
To compare two groups one category at a time, draw their bars next to each other: a clustered bar graph, also called a double bar graph when each cluster has two bars. Colours with a key tell the groups apart, and dots or slanted lines inside the bars help readers who cannot tell the colours apart. A graph can hold a lot, so read it in two steps: first identify what is given (how it is organised, the scale, the patterns), then infer what it means and test which claims the data supports. Read visualising data.
Data detective
The chapter closes with a table of the average heights of Indian boys and girls aged 5 to 19 in 1989, 1999, 2009 and 2019. Read closely, it shows children of every age taller in 2019 than in 1989, girls a little taller than boys at ages 11 and 12 in every survey, and boys pulling ahead from 13 onwards. Good data tells a story and raises new questions too. Answers to every question, including the number lock puzzle, are in the NCERT solutions for Part 2 Chapter 5.
Key terms
| Term | Meaning |
|---|---|
| Data | Facts or numbers collected to answer a question, such as the monthly price of onions in a town or the heights of the students in a class. |
| Statistical question | A question answered by collecting data in which the answers are expected to vary. “How tall are Grade 7 students in our school?” is one; “What is 15 × 4?” is not. |
| Statistics | The subject of collecting data, organising and analysing it, interpreting it and presenting it. |
| Arithmetic mean (average) | The sum of all the values divided by the number of values. It is the fair share each would get if the total were split equally. |
| Median | The middle value when the data is sorted in order. With an even number of values, it is halfway between the two middle values. |
| Outlier | A value far away from the rest of the data, like a 118 cm child in a family of adults. It pulls the mean towards itself but hardly moves the median. |
| Measures of central tendency | The mean and the median: single numbers that show where the values tend to pile up, that is, the centre of the data. |
| Variability | How spread out the data is: its minimum, its maximum, the range (maximum − minimum) and where the values cluster. |
| Dot plot | A number line with one dot for each value, stacked when a value repeats. It shows the spread and the clusters of the data at a glance. |
| Clustered bar graph | A bar graph that puts the bars for two or more groups side by side in each category, with a key for the colours. With two bars in each cluster it is a double bar graph. |
Topics in this chapter
Practice
-
What is the mean of 2, 7, 9, 4 and 3?
Show answer
Answer: (b) 5
-
What is the median of 8, 3, 12, 5 and 9?
Show answer
Answer: (b) 8 Sorted, the data is 3, 5, 8, 9, 12, and the middle value is 8.
-
What is the median of 4, 10, 6 and 8?
Show answer
Answer: (b) 7 Sorted, the data is 4, 6, 8, 10. The middle two are 6 and 8, so the median is (6 + 8) ÷ 2 = 7.
-
Which data set has an outlier?
Show answer
Answer: (b) 20, 21, 22, 90
-
A player scored 40, 0 and 20, and did not play a fourth match. What is the average per match?
Show answer
Answer: (b) 20 The 0 is a score and counts, but the match not played does not: 60 ÷ 3 = 20.
-
Which is a statistical question?
Show answer
Answer: (c) How many hours do the students in your class sleep?
Questions students ask
What are the main topics of Class 7 Maths Part 2 Chapter 5?
Statistical questions and statements; the mean as a representative value and a fair share; the median, outliers and when each average works well; dot plots and the spread of data; clustered (double) bar graphs and a two-step way to read graphs; and a data detective section on the heights of Indian children over thirty years.
Is Connecting the Dots in the new Ganita Prakash Part 2 book?
Yes. It is Chapter 5 of Ganita Prakash, the Class 7 Maths textbook Part 2 (2026-27), on pages 97 to 135. It follows on from the bar graphs of Class 6 and adds the mean, the median, dot plots and clustered bar graphs.
What is the difference between the mean and the median?
The mean adds all the values and divides by how many there are. The median is the middle value of the sorted data. An outlier changes the mean a lot but the median very little: for heights of 118, 165, 170, 173 and 175 cm, the mean is 160.2 cm but the median is 170 cm.
Stuck on a question?
Take a photo and Lagnever AI explains it step by step. Try it for 7 days for ₹2.
Get it on Google Play Open in browser
For parents: after the trial, the plan renews monthly by UPI or card autopay. You can cancel anytime in the app.