
Visualising data
Answer in short
Visualising data means showing it as a picture so its patterns stand out. A clustered bar graph puts the bars of two or more groups side by side in each category, with a colour key; with two bars per cluster it is a double bar graph. Read a graph in two steps: identify what is given, then infer.
Stuck on a question? Take a photo and Lagnever AI explains it step by step. Try it for 7 days for ₹2. Get it on Google Play
Pictures of data
Data is often easier to understand as a picture than as a table. Turning data into pictures is called data visualisation. In Class 6 you drew bar graphs for one set of data. This chapter puts two or more sets on one graph so that they can be compared at a glance.
Clubbing the columns
The onion prices of Yahapur and Wahapur could be drawn as two separate column graphs, one per town. To compare the towns month by month, it is easier to stand the two bars for each month side by side. This is a clustered column graph, and since every cluster has two columns it is also a double column graph. The towns get different colours, explained in a key.
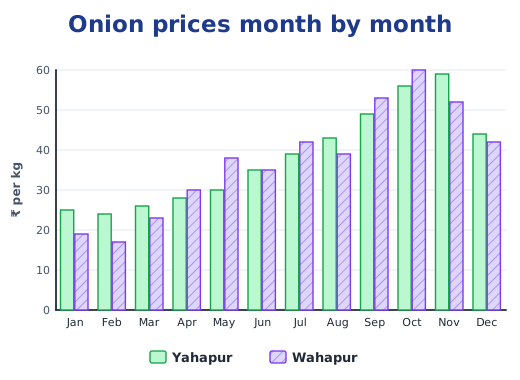
Here the scale is 1 unit = ₹10. Comparing the heights of the two bars shows at once which town was costlier in each month, and the gridlines help estimate by how much. Patterns of dots or slanted lines inside the bars help people who struggle to tell colours apart, and they survive black-and-white printing. Whether the bars stand up or lie on their side, such a graph is also called a clustered bar graph.
Reading a graph in two steps
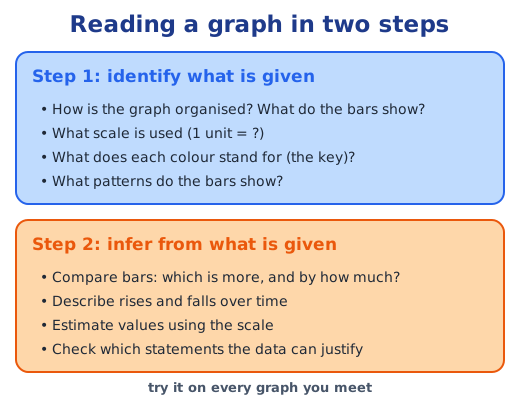
Graphs can hold a lot of information, so the book suggests two steps. Take its graph of rocket launches by organisations such as SpaceX, CASC, Roscosmos and ISRO in 2021, 2022 and 2023.
- Identify what is given. Each organisation has three bars, one for each year, and the scale is 1 unit = 20 rockets. An “Other” bar collects many smaller organisations to keep the graph short. Unlike the months of the onion graph, the order of the organisations does not matter.
- Infer from what is given. SpaceX roughly doubled its launches from 2021 to 2022 and added about 35 more in 2023. Arianespace launched fewer each year. Organisations from the USA, China and Russia launched the most.
The same steps let you test statements. The claim that only a US organisation passed 50 launches in a year is supported, since SpaceX alone did. “All organisations launched more rockets every year” is not.
Summer and winter at the same time
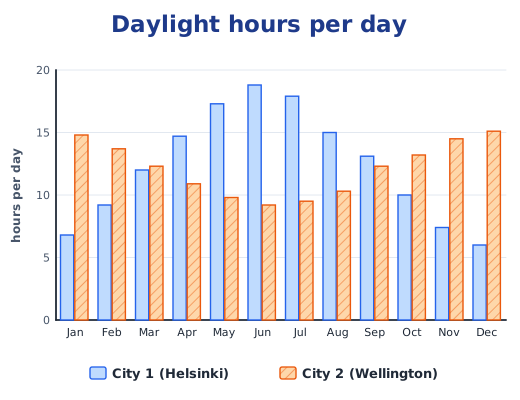
Two cities’ monthly hours of daylight, divided by the number of days in each month, give the average daylight per day. On a double bar graph with 1 unit = 5 hours, City 1 rises to about 18.8 hours a day in June (564 hours ÷ 30 days) and falls to about 6 in December, while City 2 does the opposite, from about 15 hours in December to 9 in June. City 1 is Helsinki in the Northern Hemisphere and City 2 is Wellington in the Southern, so June is summer in one and winter in the other. Both are far from the Equator, which is why their daylight swings so much.
A match in a minute
A cricket “runs per over” graph shows a whole match in one picture: overs along the bottom, runs up the side with 1 unit = 5 runs, a blue bar and a red bar for each over, and small circles where wickets fell. You can find the over with the most runs or the fewest in seconds. Some things are still hard to see; the target, for example, means adding up every bar of the team that batted first.
Choosing a scale
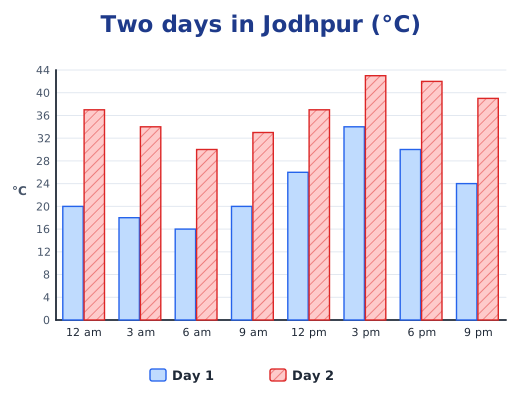
When you draw a graph yourself, choose the scale from the largest value. Jodhpur temperatures up to 43 °C suit 1 unit = 4 °C; superpower choices of at most 13 students suit 1 unit = 2 students.
Why it matters
News, weather reports and sports coverage are full of graphs. Reading them in two steps helps you spot what they show and what they leave out. Sum up data with numbers in mean and representative values and median and outliers. Answers to the textbook questions are in the NCERT solutions for Part 2 Chapter 5; see all of Part 2 Chapter 5 notes.
Practice
-
In a double bar graph of onion prices, what do the two bars in each cluster show?
Show answer
Answer: (b) The prices in the two towns in the same month
-
A graph uses the scale 1 unit = 4 °C. How tall is the bar for 28 °C?
Show answer
Answer: (b) 7 units
-
Which graph suits comparing month-by-month rainfall in two cities?
Show answer
Answer: (b) A clustered (double) bar graph
-
A double bar graph shows that Class A read 12, 15 and 9 books in three months and Class B read 10, 15 and 14. Compare the two classes month by month.
Show answer
Answer: Compare each pair of bars: in month 1 Class A read 2 more, in month 2 both read 15, and in month 3 Class B read 14 − 9 = 5 more. Over the three months Class B read 39 books and Class A 36.
-
Why do some double bar graphs add dots or slanted lines inside the bars?
Show answer
Answer: So that readers who find it hard to tell colours apart, or who see a black-and-white print, can still tell the two groups apart.
Questions students ask
What is a clustered bar graph?
A bar graph in which the bars for two or more groups stand side by side for each category, such as the onion prices of two towns for each month. A key shows which colour is which group. With two bars in a cluster, it is also called a double bar graph.
How do you choose a scale for a bar graph?
Look at the largest value and pick a step that keeps the graph a sensible size with easy numbers. Temperatures up to 43 °C fit well with 1 unit = 4 °C, so the axis needs 11 units; counts up to 13 students fit with 1 unit = 2 students.
How should you read a graph?
In two steps. First identify what is given: the title, what each axis shows, the scale, the key and the patterns. Then infer: compare bars, describe rises and falls, estimate values with the scale, and check which statements the data really supports.
Stuck on a question?
Take a photo and Lagnever AI explains it step by step. Try it for 7 days for ₹2.
Get it on Google Play Open in browser
For parents: after the trial, the plan renews monthly by UPI or card autopay. You can cancel anytime in the app.