
Median and outliers
Answer in short
The median is the middle value of data sorted in order; with an even number of values, it is the average of the two middle values. An outlier is a value far from the rest. It drags the mean towards itself but barely moves the median, so the median often represents data with outliers better than the mean.
Stuck on a question? Take a photo and Lagnever AI explains it step by step. Try it for 7 days for ₹2. Get it on Google Play
When the average misleads
Yaangba’s family heights are 169, 173, 155, 165, 160 and 164 cm, with a mean of 986 ÷ 6 ≈ 164.3 cm. Poovizhi’s family heights are 170, 173, 165, 118 and 175 cm, with a mean of 801 ÷ 5 = 160.2 cm. Does that make Yaangba’s family the taller one? Not really. Four of Poovizhi’s five family members are taller than 164.3 cm. Their mean is low only because one child, at 118 cm, is much younger and shorter than everyone else. Here the mean is lower than four of the five heights it is supposed to represent.
Finding the median
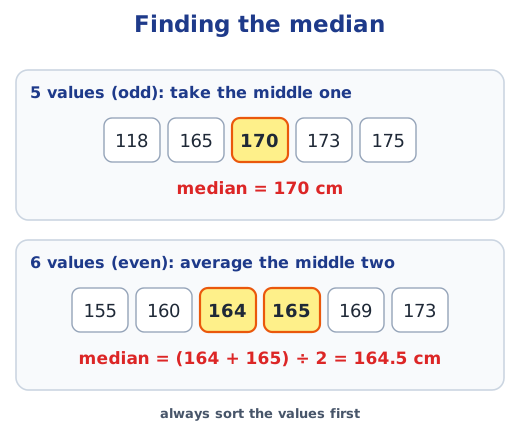
Another representative value is the median: sort the data and take the number in the middle. Poovizhi’s family sorted is 118, 165, 170, 173, 175, and the middle number is 170, so the median height is 170 cm. The median has as many values below it as above it. Yaangba’s family has six heights, 155, 160, 164, 165, 169, 173, so no single value sits in the middle. Then average the two middle values to get the median: (164 + 165) ÷ 2 = 164.5 cm. For Yaangba’s family the mean and the median nearly agree; for Poovizhi’s they are almost 10 cm apart.
Outliers
A value far away from the rest of the data, like the child’s 118 cm, is an outlier. Drop it and Poovizhi’s family has a mean of 683 ÷ 4 = 170.75 cm and a median of (170 + 173) ÷ 2 = 171.5 cm. The mean jumps by more than 10 cm while the median moves only 1.5 cm. The outlier had dragged the mean down; the median barely noticed it.
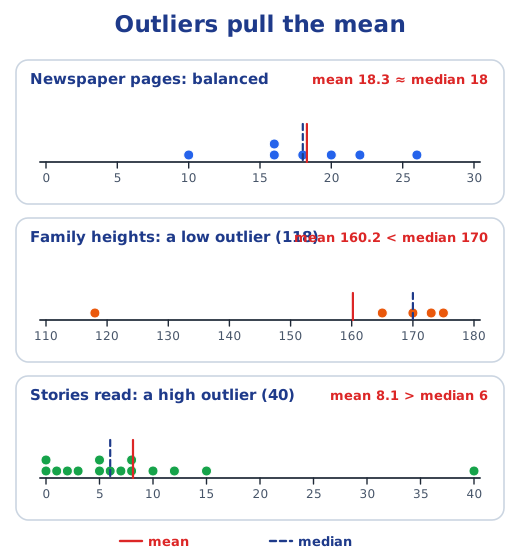
Outliers can sit at the top end too. A class reported the short stories each student read over the summer: 6, 3, 0, 8, 2, 5, 15, 7, 12, 10, 40, 5, 0, 1 and 8. One student read 40. The mean is 122 ÷ 15 ≈ 8.1 but the median is 6, so the mean lies above the median. Without the 40, the mean drops to about 5.9 and the median to 5.5. Compare a newspaper’s pages from Monday to Sunday: 16, 18, 20, 22, 26, 16 and 10. With no outlier, the mean, about 18.3, and the median, 18, are almost equal. So:
- balanced data: mean ≈ median;
- an outlier at the low end: mean < median;
- an outlier at the high end: mean > median.
The mean and the median are called measures of central tendency: they show the value around which the data tends to pile up. If there are outliers on both sides, they partly cancel, and the mean moves towards the one that is farther away.
The ends of the data
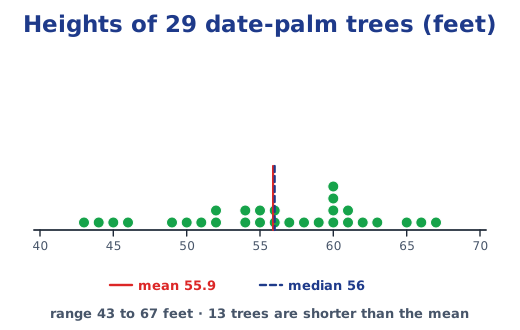
Central values are only part of the story; the spread, from the minimum to the maximum, matters too. In one Grade 5 class, the boys’ heights run from 128 to 158 cm and the girls’ from 136 to 156 cm, so both the tallest and the shortest students are boys. Yet the boys’ mean, 142.94 cm, is below the girls’ mean, 146.9 cm. The girls are taller on average, but that does not make every girl taller than every boy. A dot plot, with one dot for each value above a number line, shows all of this at once.
Zero median runs
Can a cricket team score 407 runs while its median score per batter is 0? England’s eleven batters scored 19, 0, 0, 22, 158, 0, 184, 5, 0, 0 and 0, with 19 extras. Sorted, the 6th of the 11 scores is 0, so the median is 0. The mean, though, is (407 − 19) ÷ 11 ≈ 35.27 runs, because two huge innings carried the team. Neither number alone tells the story; together, with the spread, they do.
Why it matters
Reports often give only an average, and an outlier can make that average mislead. Asking for the median and the range gives a truer picture. Compare with the mean in mean and representative values, and draw data in visualising data. Answers to the textbook questions are in the NCERT solutions for Part 2 Chapter 5; see all of Part 2 Chapter 5 notes.
Practice
-
What is the median of 9, 2, 7, 4 and 11?
Show answer
Answer: (b) 7
-
What is the median of 3, 8, 5, 10, 1 and 6?
Show answer
Answer: (b) 5.5 Sorted, the data is 1, 3, 5, 6, 8, 10. The middle two are 5 and 6, so the median is 5.5.
-
In the data 0, 1, 2, 3, 5, 6 and 40, the value 40 is:
Show answer
Answer: (c) a high outlier
-
In some data the mean is 8.1 and the median is 6. Where is an outlier likely to be?
Show answer
Answer: At the high end. A high outlier lifts the mean above the median, as 40 stories read by one student did in the bookworm data.
-
Find the range, the mean and the median of 16, 18, 20, 22, 26, 16 and 10.
Show answer
Answer: Sorted: 10, 16, 16, 18, 20, 22, 26. The range is 26 − 10 = 16, the mean is 128 ÷ 7 ≈ 18.3 and the median is 18, the 4th value. The mean and the median are close because the data is balanced.
Questions students ask
How do you find the median?
Sort the values from smallest to largest. With an odd number of values, the median is the one in the middle: for 118, 165, 170, 173 and 175 it is 170. With an even number, it is the average of the two middle values: for 155, 160, 164, 165, 169 and 173 it is (164 + 165) ÷ 2 = 164.5.
What is an outlier?
A value that is very different from the rest of the data, such as a 118 cm child in a family whose other members are 165 to 175 cm tall, or one student who read 40 stories when most read fewer than 15.
When is the median better than the mean?
When the data has an outlier at one end. The outlier changes the total, and so the mean, a lot, while the middle value hardly moves. For Poovizhi’s family the mean, 160.2 cm, is below four of the five heights, but the median, 170 cm, describes the family well.
Stuck on a question?
Take a photo and Lagnever AI explains it step by step. Try it for 7 days for ₹2.
Get it on Google Play Open in browser
For parents: after the trial, the plan renews monthly by UPI or card autopay. You can cancel anytime in the app.