
NCERT Solutions Class 8 Maths Part 2 Chapter 5: Tales by Dots and Lines
Answers to the questions inside the chapter and all three Figure it Out sets in Chapter 5, Tales by Dots and Lines, of Ganita Prakash, Grade 8 Part 2. Page numbers follow the book (pages 103–134). Readings from the book’s graphs are approximate. Short notes: Part 2 Chapter 5 notes.
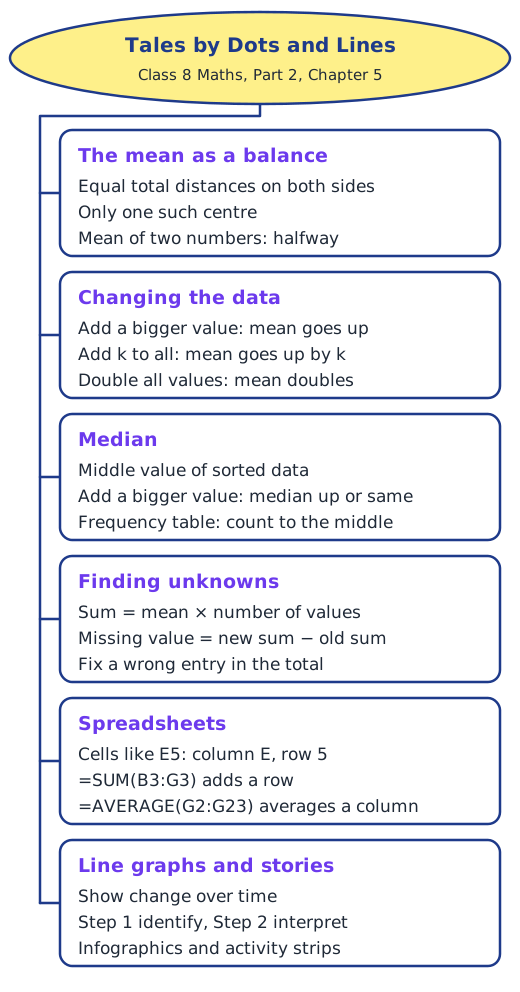
The Balancing Act (pages 103–112)
Mean of any two numbers. It is always exactly halfway between them: for 3 and 7 it is 5, for 8 and 9 it is 8.5.
Means of the collections on page 103. 6, 7, 8: mean 7. 3, 6, 9: mean 6. 2, 4, 9: mean 5. 4, 11, 15: mean 10. On page 104: 11, 13, 17, 19: mean 15. 5, 6, 15, 16: mean 10.5. 10, 10, 11, 17: mean 12. 3, 5, 10, 12: mean 7.5.
How is the mean the centre? Verify LHS = RHS. In every collection, the total distance below the mean equals the total above it. For 6, 7, 8: 1 and 1. For 3, 6, 9: 3 and 3. For 4, 11, 15: 6 and 1 + 5 = 6. For 11, 13, 17, 19: 4 + 2 = 6 and 2 + 4 = 6. For 5, 6, 15, 16: 5.5 + 4.5 = 10 and 4.5 + 5.5 = 10. For 3, 5, 10, 12: 4.5 + 2.5 = 7 and 2.5 + 4.5 = 7.
Can there be more than one centre? No. Moving the point up makes every distance below it larger and every distance above it smaller, so the totals can no longer match; moving it down does the opposite.
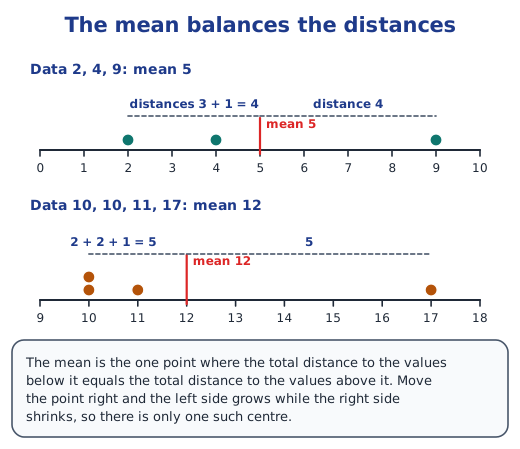
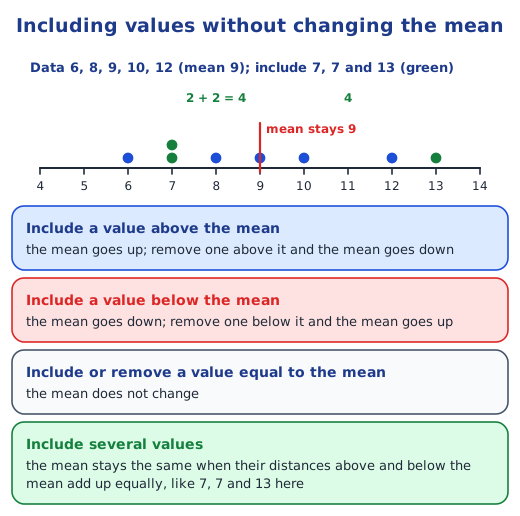
Including or removing a value. Including a value above the mean raises it, below the mean lowers it, and equal to the mean leaves it unchanged. Removing a value above the mean lowers it, removing one below raises it, and removing one equal to it changes nothing. In fair-share terms: if someone with more than the fair share joins, everyone’s share rises; if they leave, it falls.
Including or removing values without changing the mean. Two values: choose them equally far from the mean on opposite sides (with mean 9, include 7 and 11, or remove 8 and 10), or both equal to the mean. Three values: the distances must still balance, like 7, 7 and 13. Two values above and one below: for example 10 and 11 with 6, since 1 + 2 = 3.
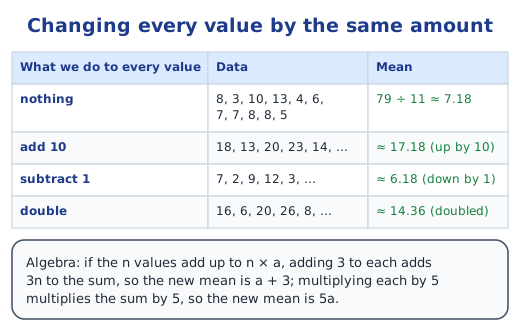
Relatively unchanged. The mean of 8, 3, 10, 13, 4, 6, 7, 7, 8, 8, 5 is 79 ÷ 11 ≈ 7.18. With every value increased by 10, the quicker way is to add 10 to the mean: about 17.18. Subtracting 2 from every value: the sum falls by 2n, so the mean falls by 2; in fair-share terms, if everyone hands back 2, each share is 2 less. Doubling every value doubles the mean.
Tinkering with the median. Including a value greater than the median raises it or leaves it the same; a smaller value lowers it or leaves it the same. For data with median 8, including 11 makes the median (8 + 11) ÷ 2 = 9.5.
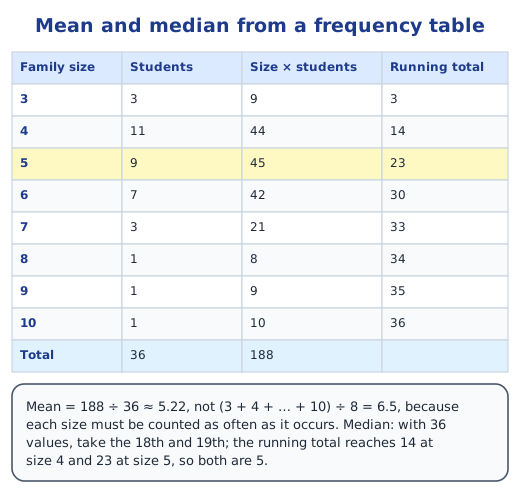
Average family size in your class. Collect each student’s family size, make a frequency table, multiply each size by its frequency, add, and divide by the number of students. For the book’s class the mean is 188 ÷ 36 ≈ 5.22, and the median, the 18th and 19th values found with a running total, is 5.
Spreadsheets. Farooq’s Maths marks are in E5. Cell B7 holds 27, Gowri’s marks in Odia. Ashwin scored more than 30 in Telugu (31), English (33) and Maths (34). The class average in Science is =AVERAGE(G2:G23), about 33.14. The class average in Odia, about 31.23, is not greater than in Telugu, about 33.59. The other averages are English 32.64, Maths 34.14 and Social Science 31.36. Totals come from =SUM(B2:G2) and so on down the rows: for example Ratna 200, Nagesh 250, Farooq 266 and Aishwarya 273, the highest, with Shravan the lowest at 102.
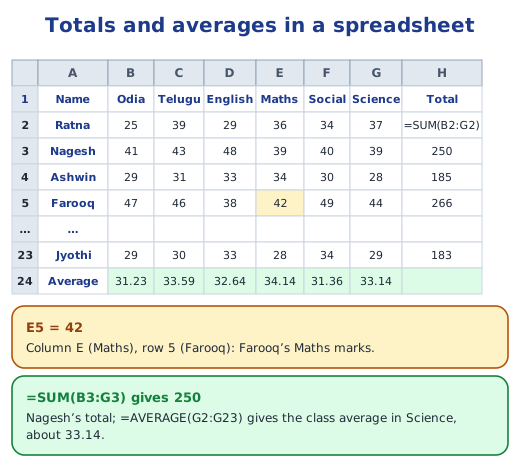
Figure it Out (pages 113–116)
1. (i) First 50 natural numbers: 1275 ÷ 50 = 25.5. (ii) First 50 odd numbers: 2500 ÷ 50 = 50. (iii) First 50 multiples of 4: 5100 ÷ 50 = 102. For evenly spaced numbers, the mean is the average of the first and last values and equals the median; the multiples of 4 have a mean 4 times that of 1 to 50.
2. The plot shows 4, 7, 8, 8, 9, 9, 9, 9, 9 and 11. Distances below 9 add up to 5 + 2 + 1 + 1 = 9, and above to 2, so the missing dot must be 7 above 9: 16.
3. (i) No need to measure again: removing the shoes lowers every height by 1 cm, so the mean falls by 1 cm. (ii) (d) 149.2 cm.
4. Album A. Its songs last 5, 5, 5.25, 5.5, 5.75, 6 and 6.5 minutes, so the mean is 39 ÷ 7 ≈ 5.57. In B and C most songs are under 5 minutes, so their means (about 2.4 and 3.9) are far below 5.57.
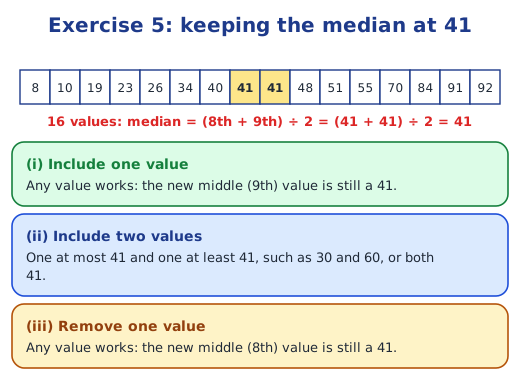
5. The 16 values sorted have 41 and 41 in the middle, so the median is 41. (i) Any one value: the new middle value is still a 41. (ii) Two values, one at most 41 and one at least 41, such as 30 and 60. (iii) Any one value can be removed.
6. (i) Never true: removing a smaller value leaves the median higher (1, 2, 3, 4, 5 becomes 2, 3, 4, 5, median 3.5) or the same (1, 3, 3, 3, 5 becomes 3, 3, 3, 5, median 3). (ii) Always true. (iii) Sometimes true: two values below and two above leave it unchanged, but four large values raise it. (iv) Never true: four smaller values lower the median or leave it the same.
7. 10.375 × 8 = 83, and 8 + 13 + 10 + 4 + 5 + 20 + 10 = 70, so y = 13.
8. Sum = 134 × 15 = 2010.
9. Sorted, the other ten values are 8, 8, 12, 18, 25, 29, 35, 39, 47, 73. With 11 values the median is the 6th, which is 29 only if p is at least 29. So p could be (iii) 40, (iv) 100, (v) 29, (vi) 47 or (vii) 30, but not 10 or 25.
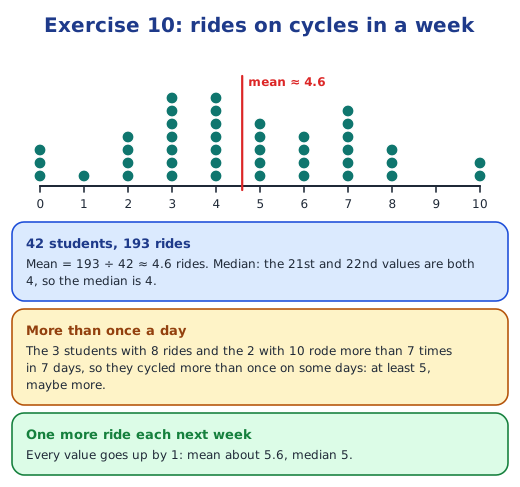
10. (i) 42 students rode 193 times in all, so the mean is about 4.6. (ii) The 21st and 22nd values are both 4: median 4. (iii) (a) Not valid: 3 students did not ride. (b) Valid: most rode between 2 and 8 times. (c) Valid: anyone with 8 or 10 rides in 7 days rode more than once on some day. (d) Not valid: those 5 students must have, but others may also have ridden twice on some day. (e) Every value goes up by 1, so the mean becomes about 5.6 and the median 5.
11. 62 students: minimum 1 throw, maximum 10. Mean = 473 ÷ 62 ≈ 7.63 throws. Median: the 31st and 32nd values are both 8, so 8 throws. Most students needed between 6 and 10 throws.
Visualising and Interpreting Data (pages 116–122)
Do both temperature graphs show the same information? Yes: the same monthly maximum temperatures, as columns and as lines. Thinking further: Kerala is near the sea and closer to the equator, while Punjab is far inland and farther north, which makes its summers hotter and winters colder; inland northern states such as Haryana, Delhi and Rajasthan show trends like Punjab’s. A plot of monthly minimum temperatures would dip much lower in Punjab’s winter while staying fairly flat for Kerala.
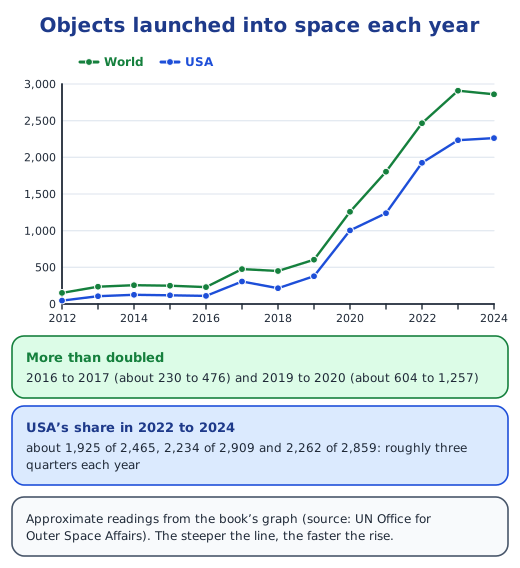
How might the launch data be collected? From records of every object launched each year, which countries report and which the UN Office for Outer Space Affairs keeps. Valid inferences: the second (the USA launched about three quarters in 2022–24) and the fourth (China and Russia together launched about 400 in 2024). Not valid: the count did not rise every year, and the graph says nothing about Nepal. More than doubled: 2016 to 2017 (about 230 to 476) and 2019 to 2020 (about 604 to 1,257).
Rainfall data. It is compiled by measuring rain daily at each city for several years and averaging the totals for each month. Kovalam, Udupi and Mumbai lie on the west coast and get heavy rain from June to August with the south-west monsoon; Rameswaram and Chennai on the east coast get most of theirs from October to December with the north-east monsoon; Puri peaks in July to September.
Figure it Out (pages 122–123)
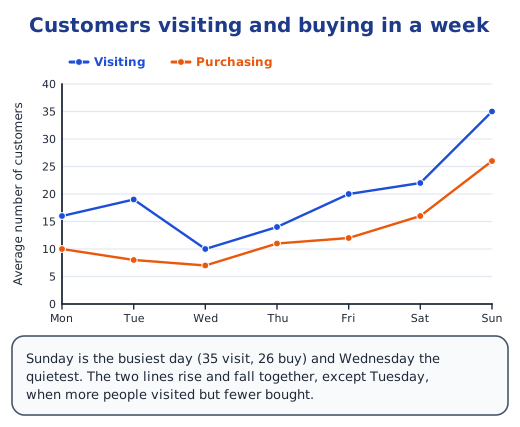
1. Plot the days across and the number of customers up, one line for visitors and one for buyers. Sunday is the busiest day and Wednesday the quietest; on Tuesday more people visited but fewer bought.
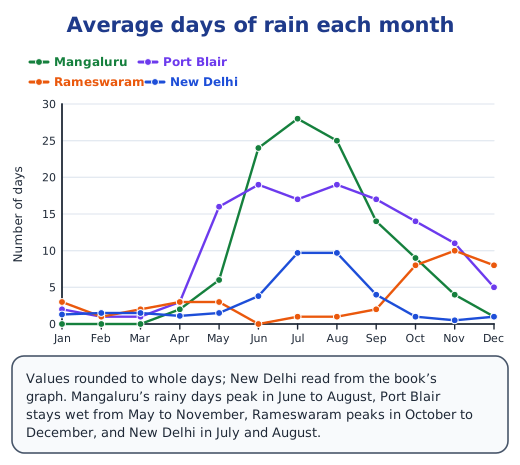
2. (i) Count the days with rain each month at each city’s weather station over many years, then average each month. (ii) See the graph. (iii) New Delhi, read from the graph: about 1, 1.5, 1.5, 1, 1.5, 4, 10, 10, 4, 1, 0.5 and 1 days from January to December, about 37 in a year. (iv) Port Blair has the most, about 126 days a year; New Delhi the fewest, about 37, with Rameswaram at about 42. (v) New Delhi’s rainy season is July and August, within June to September; Rameswaram’s is October to December.
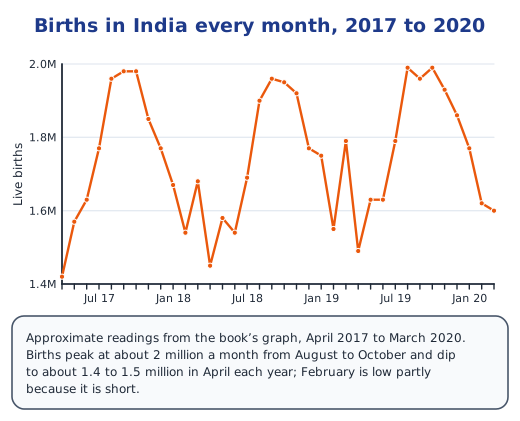
2 (births, numbered 2 again in the book). (i) The pattern repeats every year: births rise to about 2 million a month from August to October and fall to about 1.4 to 1.5 million around April; February dips partly because it is a short month. (ii) About 1.77 million (17.7 lakh) in July 2017. (iii) April 2017 to March 2020, three years of months. (iv) About 1.67 million in January 2018, 1.75 million in January 2019 and 1.77 million in January 2020: rising a little each year. (v) Adding the twelve months of 2019 gives roughly 21 million births (about 2.1 crore).
Infographics and strips (pages 123–127)
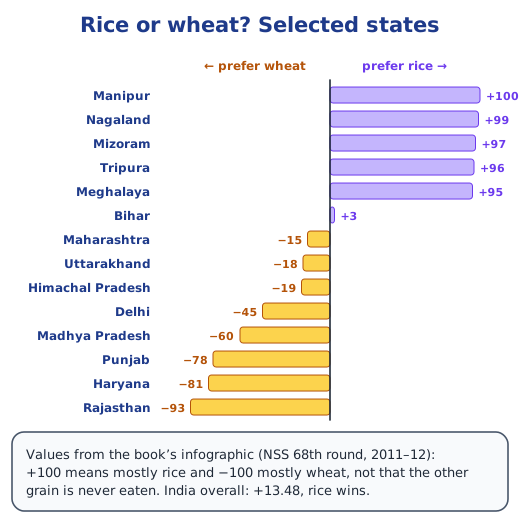
Rice versus wheat. (i) Karnataka lies south of the red line among rice-eating neighbours (Goa +57, Kerala +79, Tamil Nadu +85, undivided Andhra +92), and its shade matches theirs, so a guess of about +70 to +80 is reasonable. (ii) Rice: Manipur (+100), Nagaland (+99), Mizoram (+97), Tripura (+96) and Meghalaya (+95). (iii) Wheat: Rajasthan (−93), Haryana (−81), Punjab (−78), Madhya Pradesh (−60) and Delhi (−45). (iv) Fairly balanced: Bihar (+3), Maharashtra (−15), Uttarakhand (−18) and Himachal Pradesh (−19).
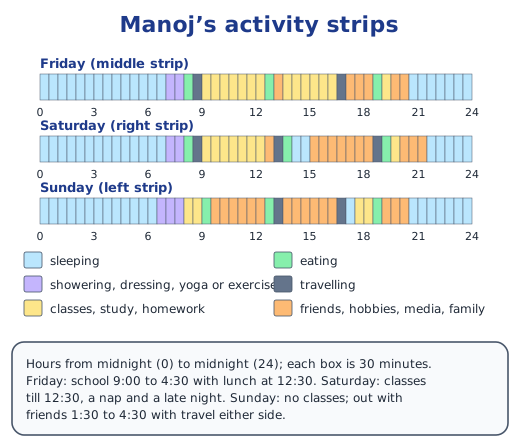
Manoj’s strips. (i) Light blue: sleeping; green: eating; purple: showering, dressing, yoga or exercise; dark grey: travelling; yellow: classes, studying and homework; orange: friends, hobbies, media and family. (ii) The middle strip is Friday (school from 9:00 to 4:30), the right strip Saturday (classes till 12:30, a nap, and bed at 9:30 pm) and the left strip Sunday (no classes, bed early at 8:30 pm before school). (iii) Most likely on Sunday, from about 1:30 to 4:30 pm: three hours with friends, with travel just before and after. (iv) At 12:30 pm, with lunch till 1:00 and a break till 1:30. (v) He sleeps about 10½ hours every day, eats at regular times, and spends about 7 hours on classes and study on Friday but only 2 on Sunday.
Your own strips. A weekday strip will show school hours and travel; a vacation strip more sleep, play and family time; an adult’s strip work hours, travel and chores. Compare where the colours bunch together.
Sleep by age. Sleep falls from about 9.5 hours at age 6 to about 8 hours between 30 and 50, then rises to about 8.5 hours later in life.
Figure it Out (pages 127–132)
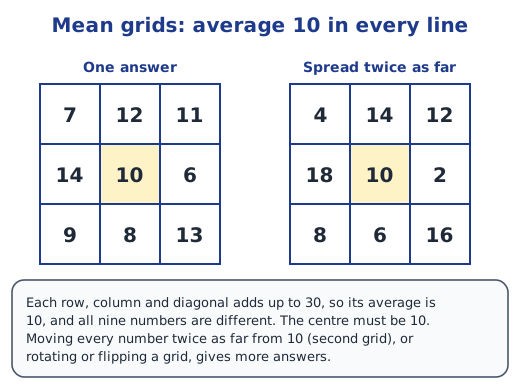
1. Mean grids. (i) 7, 12, 11 / 14, 10, 6 / 9, 8, 13: every row, column and diagonal adds to 30, an average of 10. (ii) Yes: rotating or flipping the grid, or moving every number twice as far from 10 (4, 14, 12 / 18, 10, 2 / 8, 6, 16), keeps all the averages at 10. The centre must stay 10.
2. (i) 7, 8, 9; or 2, 10, 12. (ii) 12, 14, 17, 19; or 15, 15, 16, 16. (iii) 10, 12, 14, 16, 16; or 13, 13, 14, 14, 14 (sum 68). (iv) 1, 2, 3, 4, 5, 6; or 2, 4, 6, 6, 8, 10. (v) 1, 2, 3, 4, 5, 30; or 1, 1, 1, 1, 2, 100.
3. With six values, the 3rd and 4th must average 13, so they are 13 and 13, or 12 and 14. With 13 and 13, the third blank is any counting number up to 13 (13 ways). With 12 and the given 14, the blanks are 12, a number from 1 to 12, and any number from 14 upwards, so there are infinitely many possibilities.
4. The six values must add up to 6 × 6.5 = 39; the four given add up to 35, so the blanks add up to 4: 1 and 3, 2 and 2, or 3 and 1, 3 possibilities.
5. All three are false. (i) 2 and 4 average 3, which is odd; in general (2a + 2b) ÷ 2 = a + b, even only when a + b is even. (ii) 5 and 10 average 7.5; (5a + 5b) ÷ 2 = 5(a + b) ÷ 2. (iii) 5, 5, 5, 5 and 10 average 6; the average of 5a, 5b, 5c, 5d and 5e is a + b + c + d + e, any whole number.
6. (i) Only (c) is correct: the two new heights are needed, but no one else has to be measured again; the mean may rise, fall or stay. (ii) (b): the newcomers average 150.5 cm, above 150.2, so the mean rises slightly, to (24 × 150.2 + 149 + 152) ÷ 26 ≈ 150.22 cm. (iii) (d): without the class’s heights we cannot tell where 149 and 152 lie compared with the median.
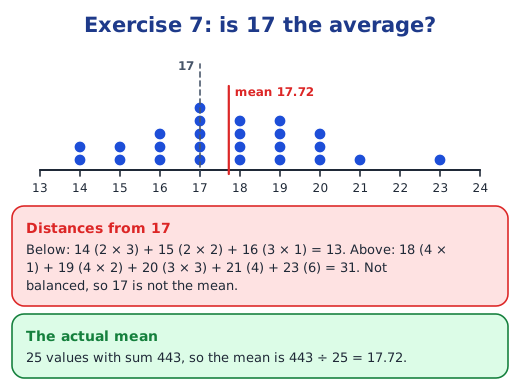
7. No. The distances below 17 total 13 and those above total 31, so 17 does not balance the data; the 25 values add up to 443, a mean of 17.72.
8. The total change is −2 + 1 + 1 = 0 kg, so the mean stays 65.3 kg. The median may or may not change, depending on whose weights changed, so we cannot say.
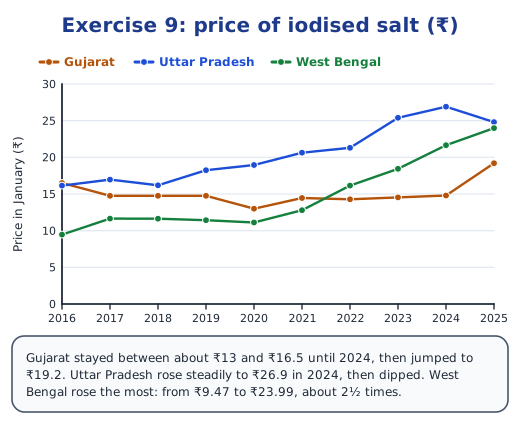
9. (i) See the graph for Gujarat, Uttar Pradesh and West Bengal. (ii) Prices in most states rose after 2020; Mizoram’s were the highest throughout, reaching ₹29.80. (iii) Gujarat stayed between about ₹13 and ₹16.50 until 2024 and jumped to ₹19.20 in 2025, while Uttar Pradesh rose steadily to ₹26.90 in 2024, then fell to ₹24.81. (iv) West Bengal, from ₹9.47 to ₹23.99, a rise of ₹14.52. (v) For example, why salt prices differ so much between states.
10. (i) Valid: in 1983 about 83% of rural households used kerosene and about 64% of urban households used electricity. (ii) Valid. (iii) Not valid: in 2000 about 90% of urban households used electricity; about 10% used kerosene. (iv) Not valid: the graph shows the main lighting source, not power cuts.
11. (i) About 2 hours (a little over 2). (ii) (d) 14 years. (iii) (a) Not correct: at 15 it is about 1 to 1¼ hours, about half of the time at 10, not twice. (b) Not correct: the graph shows an average, so some rural 15-year-olds may spend less than an hour.
12 and 13. Projects. Record each half hour on a 48-box strip for several days, find the average time per activity, and draw an ‘average day’ strip. For sleep, add night sleep and naps for each family member, and compare the average and median for children, adults and the elderly. For school timings, list start and end times and break lengths and compare their mean and median.
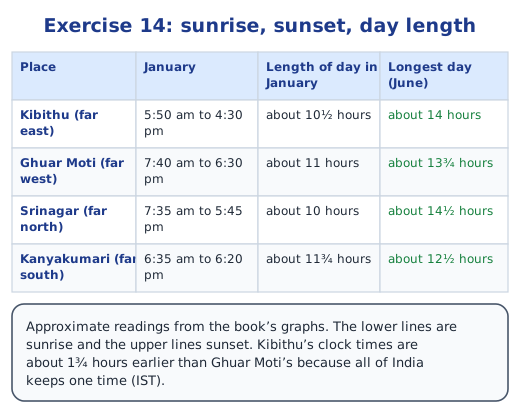
14. The lower lines are sunrise and the upper lines sunset. (i) Kibithu: sunrise about 5:50 am in January, sunset about 4:30 pm, a day of about 10½ hours. (ii) Srinagar, about 14½ hours of daylight in June. (iii) Kanyakumari’s day length hardly changes (about 11¾ to 12½ hours), while places farther north change much more; and Kibithu’s clock times are about 1¾ hours earlier than Ghuar Moti’s because the whole country keeps one time.
15. (i) Purnima was around the 13th: the Moon rose near sunset (about 17:25 on the 13th) and set near sunrise. Amavasya was around the 28th: the Moon rose with the Sun (about 06:15) and set around 17:00. (ii) Moonrise and moonset come later every day, by about 35 to 65 minutes and about 50 on average, so on one day there is no moonset (the 6th) and on another no moonrise (the 21st), when the time passes midnight.
Practice
-
The mean of the first 50 odd numbers is:
Show answer
Answer: (c) 50
-
The mean of 8, 13, 10, 4, 5, 20, y, 10 is 10.375. The value of y is:
Show answer
Answer: (c) 13
-
Heights measured with 1 cm shoes average 150.2 cm. The true average is:
Show answer
Answer: (c) 149.2 cm
-
Is 17 the mean of the Exercise 7 dot plot?
Show answer
Answer: No. The distances below 17 add up to 13 and those above to 31, so they do not balance; the 25 values add up to 443, so the mean is 17.72.
-
The mean of 15 values is 134. What is their sum?
Show answer
Answer: Sum = mean × number of values = 134 × 15 = 2010.
Stuck on a question?
Take a photo and Lagnever AI explains it step by step. Try it for 7 days for ₹2.
Get it on Google Play Open in browser
For parents: after the trial, the plan renews monthly by UPI or card autopay. You can cancel anytime in the app.