
Class 8 Maths Part 2 Chapter 5: Tales by Dots and Lines Notes
This chapter in five lines
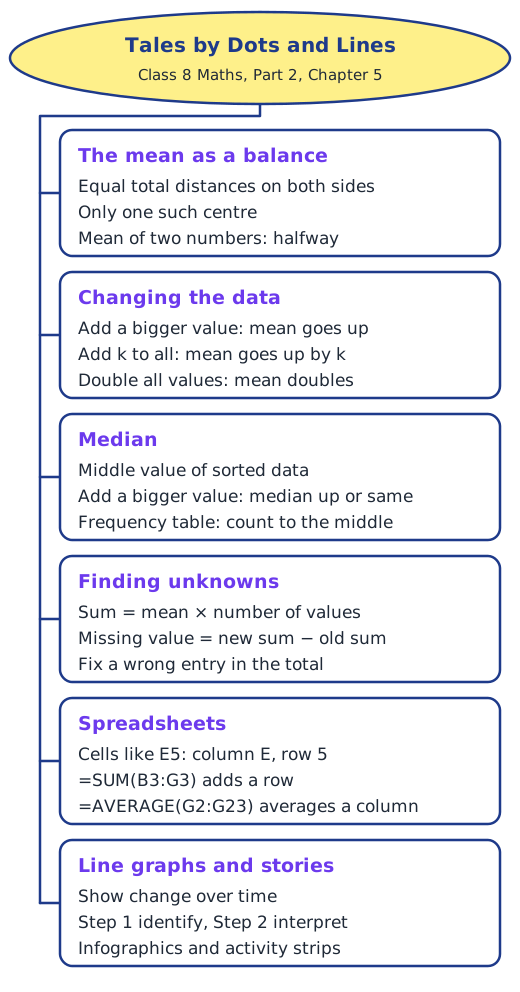
Tales by Dots and Lines looks at data in two ways. With dot plots it shows that the mean balances the total distances on either side, and how the mean and median change when values are included, removed or changed. With line graphs, infographics and activity strips it shows how to read data step by step and draw careful conclusions.
What is this chapter about?
Last year the mean was a fair share and the median the middle value. This chapter looks at both again with dot plots, asking how they behave when the data changes, and then turns to line graphs, infographics and activity strips to see what real data can tell us, and what it cannot.
The mean as a balancing point
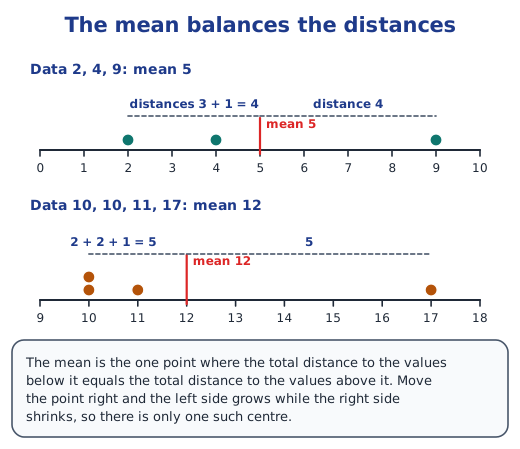
The mean of two numbers lies exactly halfway between them. With more numbers, the mean is not always the midpoint of the extremes; instead, the total distance to the values below the mean equals the total distance to the values above it. For 2, 4 and 9 the mean 5 has distances 3 + 1 = 4 on the left and 4 on the right. Only one point balances like this. Read the mean as a balancing point.
When the data changes
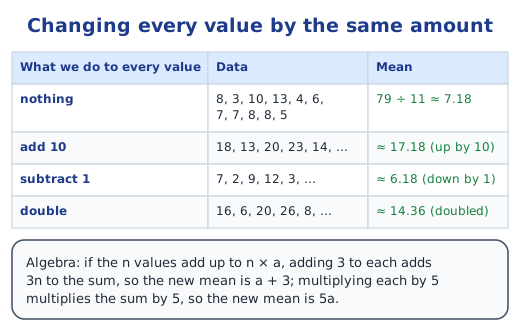
Including a value above the mean raises the mean, a value below lowers it, and a value equal to it changes nothing; removing values works the other way. Several values can be included without moving the mean if their distances balance. If every value goes up by 10, the mean goes up by 10; if every value is doubled, the mean doubles, which algebra proves.
Median and frequency tables
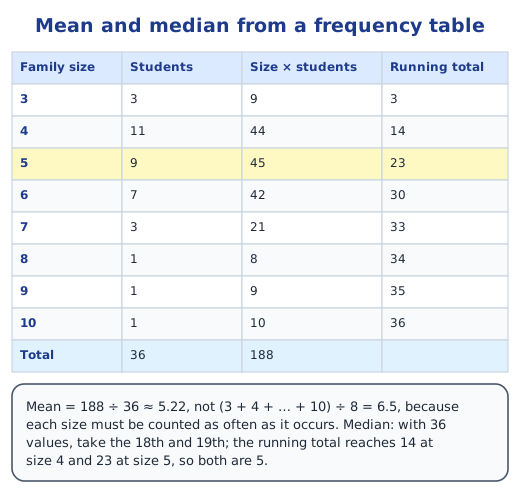
Including a value above the median can only push it up or leave it; a value below can only pull it down or leave it. When data comes as a frequency table, multiply each value by its frequency to find the mean, and use a running total to reach the middle position for the median. For family sizes of 36 students the mean is about 5.22 and the median 5. Read mean and median from a frequency table.
Finding unknown values
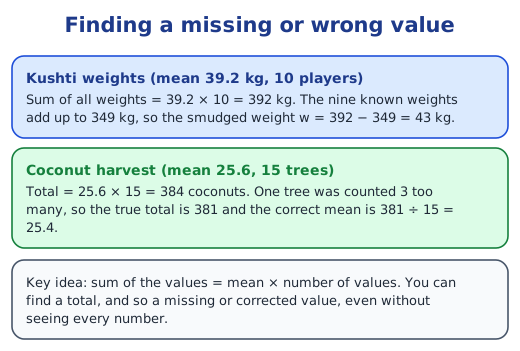
Since sum = mean × number of values, a missing value can be found from the mean: ten wrestlers averaging 39.2 kg weigh 392 kg in all, so the smudged weight is 392 − 349 = 43 kg. A wrong entry can be fixed the same way.
Spreadsheets
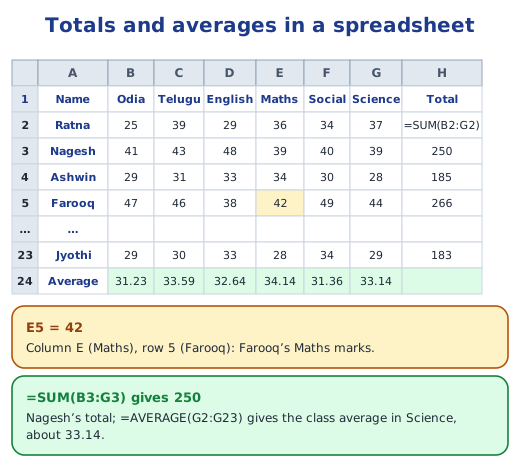
A spreadsheet is a digital notebook of cells named by column and row, so E5 is column E, row 5. A formula such as =SUM(B3:G3) adds a row and =AVERAGE(G2:G23) averages a column, so a teacher can total and average the marks of a whole class in seconds.
Line graphs
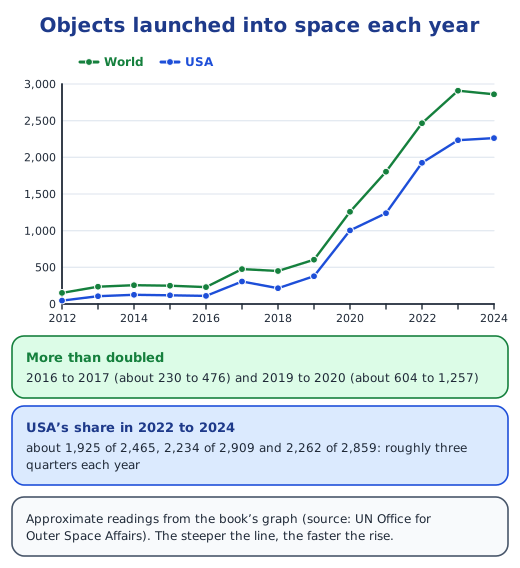
A line graph joins data points with line segments and suits data over time. Read it in two steps: first identify what is given (the title, axes, scale, colours and pattern), then infer and interpret. Punjab’s monthly maximum temperature swings from about 19°C to 38°C, while Kerala’s stays between about 29°C and 33°C. Read line graphs.
Infographics and activity strips
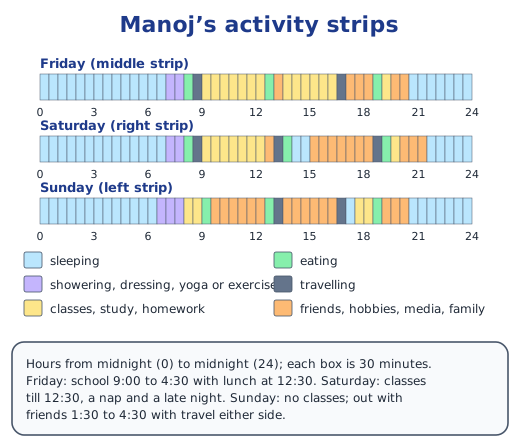
An infographic packs data into a picture: one map shows that states south and east of a line prefer rice and those to the north-west prefer wheat. An activity strip of 48 half-hour boxes shows how a day was spent, and comparing strips reveals weekdays, weekends and outings.
Before we move on
The mean balances distances, while the median sits in the middle, and both respond to changes in the data in predictable ways. Line graphs show change over time, and examining data leads to new questions. Answers to every question are in the NCERT solutions for Part 2 Chapter 5.
Key terms
| Term | Meaning |
|---|---|
| Mean (average) | The sum of all values divided by the number of values; the point where the distances on both sides balance. |
| Median | The middle value of sorted data; with an even number of values, the average of the two middle values. |
| Dot plot | A number line with a dot for each value, stacked when values repeat. |
| Measure of central tendency | A single value, such as the mean or median, that represents the centre of the data. |
| Frequency | The number of times a value occurs in the data. |
| Frequency table | A table listing each value with its frequency. |
| Running total | Frequencies added one after another, used to find which value sits in a given position. |
| Spreadsheet | A digital table of cells, named by column letter and row number, such as E5. |
| Formula | An instruction in a cell, such as =SUM(B3:G3) or =AVERAGE(G2:G23), that calculates from other cells. |
| Line graph | A graph of points joined by line segments, mainly used to show change over time. |
| Clustered column graph | A bar graph with groups of columns side by side, one group per category. |
| Infographic | A picture that combines data, colour and text to tell a story at a glance. |
| Activity strip | A strip of boxes, each for a fixed time, coloured to show what was done in that time. |
Topics in this chapter
Practice
-
The mean of 2, 4 and 9 is:
Show answer
Answer: (b) 5
-
If every value in a data set is increased by 10, the mean:
Show answer
Answer: (b) increases by 10
-
The median of 4, 6, 8, 11, 13 is:
Show answer
Answer: (b) 8
-
In a spreadsheet, cell E5 is in:
Show answer
Answer: (b) column E, row 5
-
Line graphs are mainly used to show:
Show answer
Answer: (b) change over time
-
The mean of 10 values is 39.2. Their sum is:
Show answer
Answer: (c) 392
Questions students ask
What are the main topics of Class 8 Maths Part 2 Chapter 5?
The mean as a balancing point; how the mean changes when values are included, removed or all changed by the same amount; how the median changes; finding a missing value; mean and median from a frequency table; spreadsheets; line graphs; infographics; and activity strips.
Is Tales by Dots and Lines in the new NCERT Class 8 Maths book?
Yes. It is Chapter 5 of Ganita Prakash, Grade 8 Part 2, on pages 103 to 134 of the first edition (December 2025).
Why is the mean called a balancing point?
Because the total distance from the mean to the values below it always equals the total distance to the values above it, like a see-saw balanced at that point. No other point does this.
When should we use a line graph?
When data changes over time, such as monthly temperatures or yearly launches. Joining the points shows rises, falls and patterns clearly, and many points stay readable where a column graph would look crowded.
Stuck on a question?
Take a photo and Lagnever AI explains it step by step. Try it for 7 days for ₹2.
Get it on Google Play Open in browser
For parents: after the trial, the plan renews monthly by UPI or card autopay. You can cancel anytime in the app.