
Mean and median from a frequency table
Answer in short
A frequency table lists each value with how often it occurs. For the mean, multiply each value by its frequency, add the products and divide by the total frequency. For the median, add the frequencies one by one until the running total reaches the middle position; the value there is the median.
Stuck on a question? Take a photo and Lagnever AI explains it step by step. Try it for 7 days for ₹2. Get it on Google Play
The median and how it moves
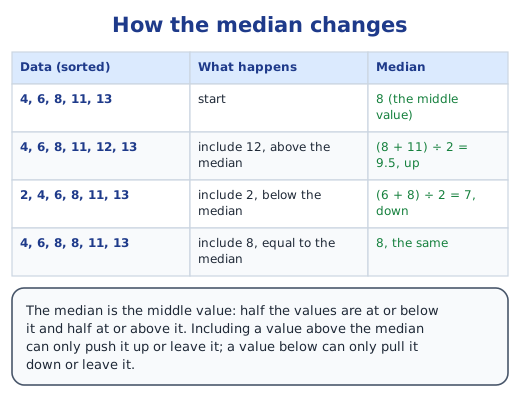
Once the data is put in order, the median is the value in the middle, with as many values below it as above it; with an even number of values, it is the average of the two middle values. What happens when a value is included? Take 4, 6, 8, 11, 13, with median 8. Include 12, which is above the median: now there are six values and the median is (8 + 11) ÷ 2 = 9.5, so it has gone up. Include 2 instead, below the median, and it falls to (6 + 8) ÷ 2 = 7. A value above the median can only push it up or leave it the same; a value below can only pull it down or leave it.
What a frequency table is
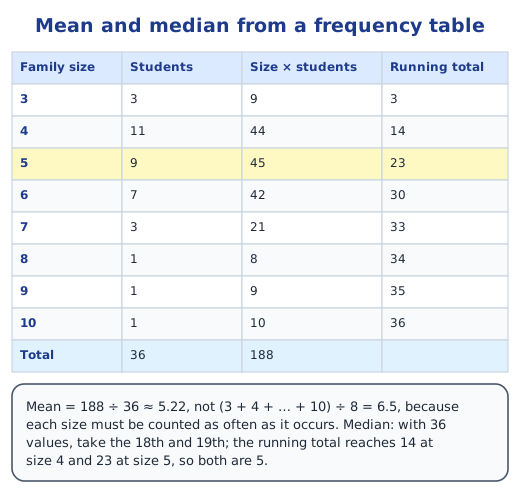
When a value repeats many times, writing every value is slow. A frequency table lists each value once with its frequency, the number of times it occurs. The chapter’s class records family sizes: 3 people for 3 students, 4 for 11 students, 5 for 9, 6 for 7, 7 for 3, and 8, 9 and 10 for one student each, 36 students in all.
Finding the mean
A tempting shortcut is (3 + 4 + 5 + 6 + 7 + 8 + 9 + 10) ÷ 8 = 6.5, but that treats each family size as if it occurred once. The mean must add every value, so each size is multiplied by its frequency: 3 × 3 + 4 × 11 + 5 × 9 + 6 × 7 + 7 × 3 + 8 × 1 + 9 × 1 + 10 × 1 = 188. Dividing by the 36 students gives a mean family size of 188 ÷ 36 ≈ 5.22.
Finding the median with a running total
With 36 values, the median is the average of the 18th and 19th values in sorted order. Instead of writing out all 36 numbers, keep a running total of the frequencies: sizes 3 and 4 cover positions 1 to 14 (3 + 11), and size 5 covers positions 15 to 23 (14 + 9). Both the 18th and the 19th values are therefore 5, and the median family size is 5.
Another table: darts
In a dart competition, 62 students took between 1 and 10 throws to hit the bull’s eye: 1 student took 1 throw, 1 took 4, 4 took 5, 9 took 6, 12 took 7, 15 took 8, 10 took 9 and 10 took 10. The minimum is 1 and the maximum 10. The total of throws is 473, so the mean is 473 ÷ 62 ≈ 7.63. The median is the average of the 31st and 32nd values: the running total reaches 27 at 7 throws and 42 at 8, so both are 8 and the median is 8.
A dot plot works the same way
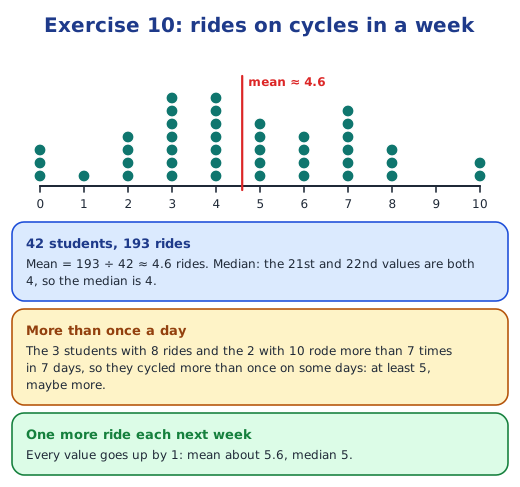
A dot plot is a frequency table drawn as stacks. In the chapter’s plot of how often 42 students rode their cycles in a week, the stack heights are the frequencies: 3 students rode 0 times, 1 rode once, 4 twice, 7 three times, 7 four times, 5 five times, 4 six times, 6 seven times, 3 eight times and 2 ten times. That is 193 rides, a mean of about 4.6, and a median of 4.
Mean or median?
Both describe the centre, but in different ways. The mean uses every value and balances their distances, so one very large or very small value can pull it a long way. The median depends only on the order, so it stays put unless values cross the middle. Looking at both, along with the minimum and maximum, gives a fuller picture of the data.
Read on: the mean as a balancing point, line graphs, the chapter notes and the NCERT solutions.
Practice
-
With 36 values, the median is the average of the values at positions:
Show answer
Answer: (b) 18 and 19
-
62 students took 1 to 10 throws to hit the bull’s eye (table in Exercise 11). The median number of throws is:
Show answer
Answer: (c) 8
-
Including a value smaller than the median can make the median:
Show answer
Answer: (b) smaller or the same
-
Find the mean when the value 2 occurs 3 times and the value 5 occurs 2 times.
Show answer
Answer: (2 × 3 + 5 × 2) ÷ (3 + 2) = (6 + 10) ÷ 5 = 16 ÷ 5 = 3.2.
-
In the cycling dot plot of 42 students, why is the median 4?
Show answer
Answer: With 42 values the median is the average of the 21st and 22nd. The running total reaches 15 at 3 rides and 22 at 4 rides, so both of these values are 4.
Questions students ask
How do you find the mean from a frequency table?
Multiply each value by its frequency, add all these products to get the sum of the data, and divide by the total of the frequencies, which is the number of values.
How do you find the median from a frequency table?
Work out the middle position: for n values, position (n + 1) ÷ 2, or the two positions either side when n is even. Then add the frequencies from the smallest value upwards until the running total reaches that position.
How does including a value change the median?
A value above the median can only raise it or leave it the same; a value below can only lower it or leave it. It stays the same when the middle values are equal, as in data where several values equal the median.
Stuck on a question?
Take a photo and Lagnever AI explains it step by step. Try it for 7 days for ₹2.
Get it on Google Play Open in browser
For parents: after the trial, the plan renews monthly by UPI or card autopay. You can cancel anytime in the app.