
Line graphs: reading change over time
Answer in short
A line graph marks data points and joins them with line segments, so it shows how something changes over time. Read it in two steps: first identify the title, axes, scale, colours and pattern; then infer and interpret, keeping in mind how the data was collected and what it does not show. The steeper the line, the faster the change.
Stuck on a question? Take a photo and Lagnever AI explains it step by step. Try it for 7 days for ₹2. Get it on Google Play
From columns to lines
We already know pictographs, bar graphs, clustered column graphs and dot plots. The chapter shows the monthly maximum temperatures of Kerala and Punjab in 2023 first as a clustered column graph and then with each state’s points joined by lines. Both show the same information, but the line graph makes the change from month to month much easier to follow. Line graphs are mostly used for data over time.
Two steps to read any graph
Step 1: identify what is given. Look at the title, what each axis shows (months across, °C up), the scale, and which colour and marker stands for which state. Different marker shapes help when the graph is printed in black and white, or for readers who find colours hard to tell apart. Ask how the data was collected: a state’s monthly maximum comes from the highest reading at its weather stations. Knowing this shows the data’s scope and limits.
Step 2: infer and interpret. Punjab’s maximum climbs from about 19°C in January to 38°C in June, dips just under 35°C in July, stays flat till September and falls to about 23°C by December. Kerala’s stays almost flat, between about 29°C in July and 33°C in April. So Punjab’s temperature varies far more. Good reading also raises new questions, such as why the two states differ.
Space jam
A line graph of objects launched into space each year shows the world total and the counts for the USA, China and Russia from 2012 to 2024. The world count was around 2,900 in 2023 and 2,800 in 2024, so 2023 was the highest. The three countries do not add up to the world count, so other countries are left out. The USA’s line is steeper from 2022 to 2023 than from 2023 to 2024: the steeper the line, the greater the increase.
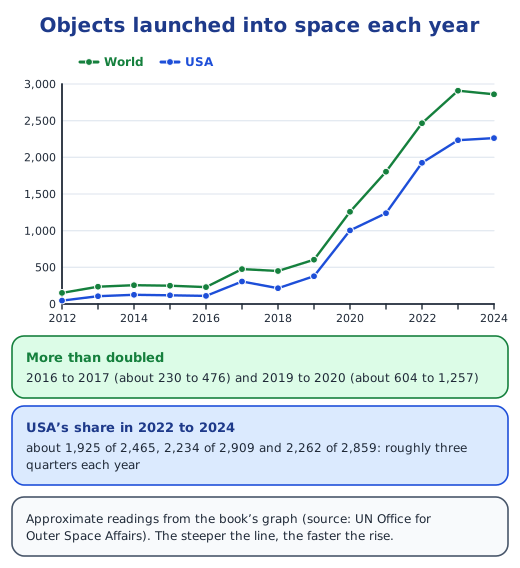
Some statements are valid inferences and some are not. The USA launched roughly three quarters of all objects in 2022 to 2024, and China and Russia together launched about 400 in 2024. But the world count did not rise every year, and the graph cannot tell us about Nepal at all. Drawn as a clustered column graph, this data would need 52 columns; the line graph shows the trend far more clearly.
Rain through the year
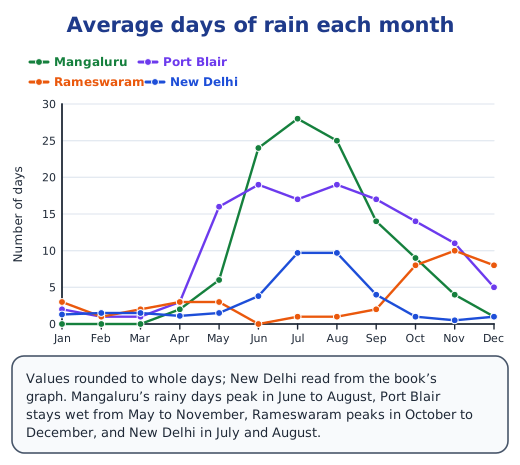
Monthly average rainfall comes from measuring rain for several years and averaging each month. Graphs for six coastal cities show that Kovalam, Udupi and Mumbai on the west coast get much more rain, peaking from June to August, while Rameswaram on the east coast gets most of its rain from October to December and Chennai peaks in November. Puri, though on the east coast, peaks from July to September. January to March is dry everywhere. The number of days of rain tells a similar story.
Drawing a line graph yourself
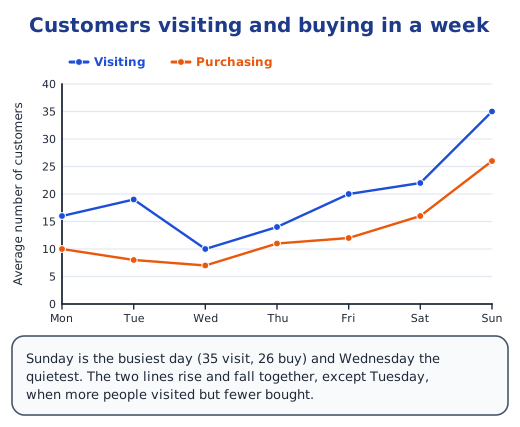
To draw one, mark the times on the horizontal axis, choose a scale for the vertical axis, plot each value and join the points. For a shop’s average customers, one line for visitors and one for buyers show that Sunday is the busiest day and that buying follows visiting.
A pattern that repeats
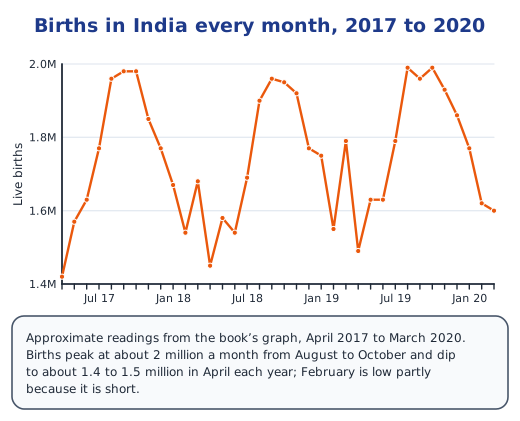
A graph of births in India every month from April 2017 to March 2020 shows a wave that repeats each year: births peak at about 2 million a month from August to October and dip to about 1.4 to 1.5 million around April. A repeating shape like this is easy to spot on a line graph.
Infographics and smooth curves
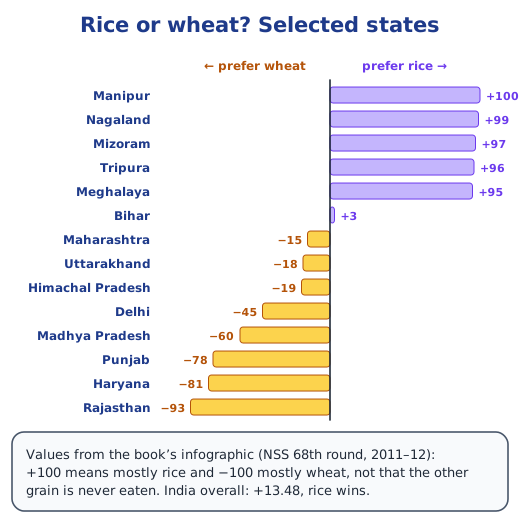
An infographic tells a story in a picture. One map gives each state a value from −100 (mostly wheat) to +100 (mostly rice) and draws a line between the rice-preferring south and east and the wheat-preferring north-west; overall, India scores +13.48, so rice wins. A line graph of typical sleep by age looks like a smooth curve because its points are very close together: about 9.5 hours at age 6, falling to about 8 hours between 30 and 50, then rising to about 8.5 hours.
Read on: the mean as a balancing point, mean and median from a frequency table, the chapter notes and the NCERT solutions.
Practice
-
Which is better for 13 years of data for 4 groups?
Show answer
Answer: (b) a line graph
-
In the space-launch graph, the world count more than doubled from:
Show answer
Answer: (b) 2016 to 2017
-
Which city gets most of its rain from October to December?
Show answer
Answer: (c) Rameswaram
-
Why do some graphs use different marker shapes as well as colours?
Show answer
Answer: So that the lines can still be told apart when the graph is printed in black and white, and by people who find it hard to tell colours apart.
-
How might monthly average rainfall be compiled?
Show answer
Answer: Rainfall is measured at a weather station for many years; the totals for each month are added across the years and divided by the number of years.
Questions students ask
What is a line graph used for?
Mainly to show how a quantity changes over time, such as monthly temperatures, yearly launches or monthly births. The joined points make rises, falls and repeating patterns easy to see.
How do you read a line graph?
First identify what is given: the title, what each axis shows, the scale, which colour or marker stands for what, and the overall pattern. Then infer and interpret: describe the trends, compare the lines, and note what the data cannot tell you.
What is an infographic?
A picture that combines data with colours, shapes and short text so that a pattern can be understood quickly, such as a map coloured by how much each state prefers rice or wheat.
Stuck on a question?
Take a photo and Lagnever AI explains it step by step. Try it for 7 days for ₹2.
Get it on Google Play Open in browser
For parents: after the trial, the plan renews monthly by UPI or card autopay. You can cancel anytime in the app.