
NCERT Solutions Class 8 Social Science Part 2 Chapter 6: Dynamics of Population
Answers to the Big Questions, every Let’s Explore and Think About It box, and all twelve Questions and activities in Chapter 6, Dynamics of Population, of Exploring Society: India and Beyond, Grade 8 Part 2. Page numbers follow the book (pages 167–190). Short notes: Part 2 Chapter 6 notes.
The Big Questions (page 167)
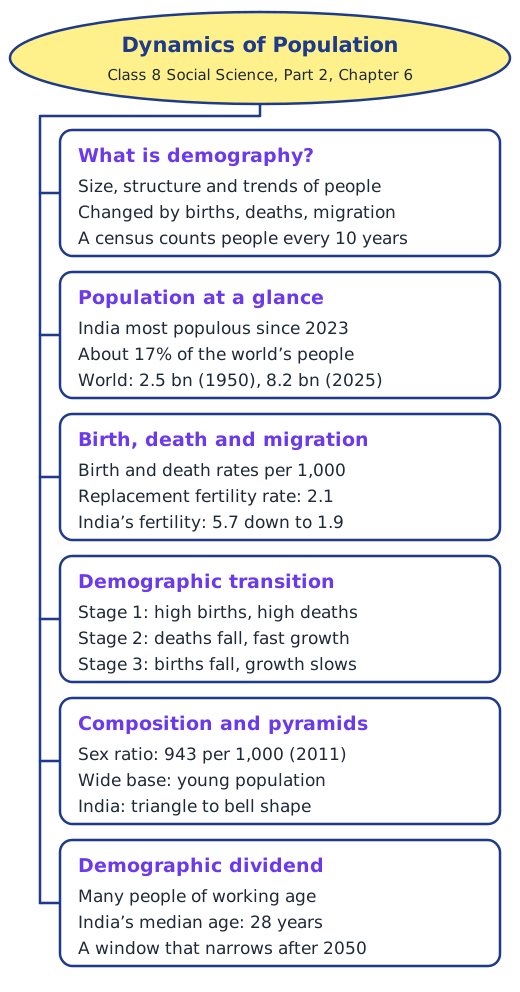
1. What is demography? The study of a human population: how many people there are, how the population is made up (age, gender, education, work, religion and so on), and how these features change over time through births, deaths and migration.
2. Which ideas are important in demography? The birth rate and death rate (per 1,000 people in a year); the fertility rate, with 2.1 as the replacement level; child mortality and life expectancy; migration; the sex ratio; the population pyramid; the demographic transition; and the demographic dividend.
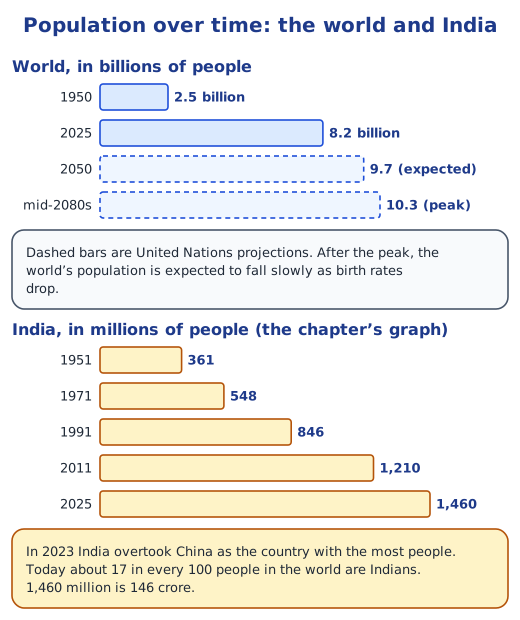
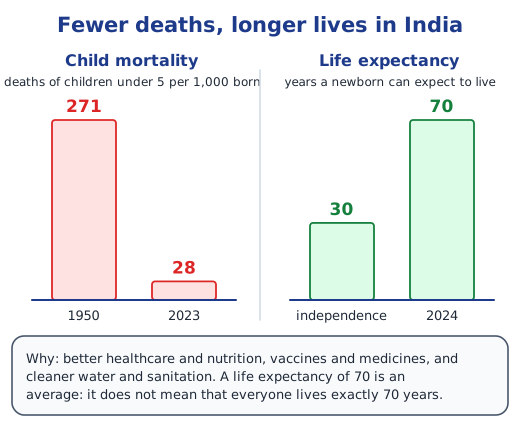
3. How have the populations of India and the world changed? The world had 2.5 billion people in 1950 and 8.2 billion in 2025, and may peak at about 10.3 billion in the mid-2080s. India grew from 361 million in 1951 to 1,460 million in 2025 and became the most populous country in 2023. Its fertility rate fell from 5.7 to 1.9, life expectancy rose from 30 to 70 years, and its population pyramid changed from a narrow triangle to a bell.
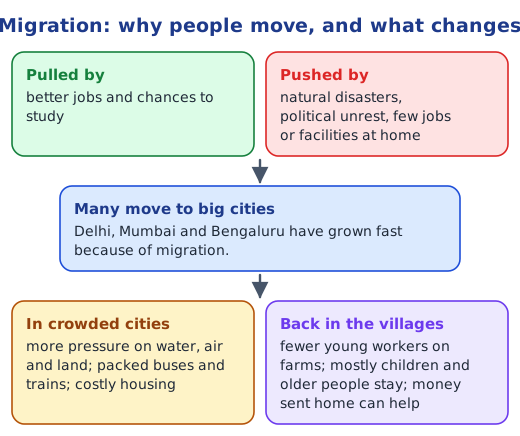
4. How do population trends affect society and the economy? A young population needs schools and jobs, and can speed up growth if it is educated and employed. An ageing population needs more healthcare and pensions while the number of workers falls, which can slow the economy. Migration makes cities crowded and empties villages of young workers. Smaller families change how children are raised and who looks after the elderly.
Let’s Explore and Think About It (pages 172–186)
Changes around us (page 172). Families often notice farmland turned into housing colonies, more traffic on the roads, and more people living in smaller flats. Possible reasons: the population has grown; many people have moved to towns and cities for work and study; more families live on their own instead of in large joint households, so more homes are needed; and higher incomes mean more cars and scooters.
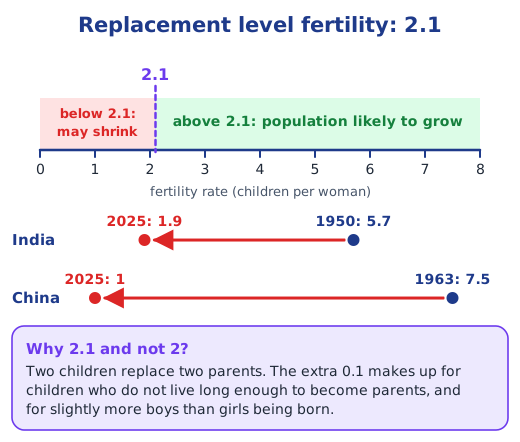
Why 2.1, not 2? (page 173). Two children would replace two parents only if every child lived to become a parent. Some children die before growing up, and slightly more boys than girls are born, so a little over two children per woman are needed. The replacement rate is higher where many children die young, for example where healthcare and nutrition are poor, and where fewer girls survive to adulthood.
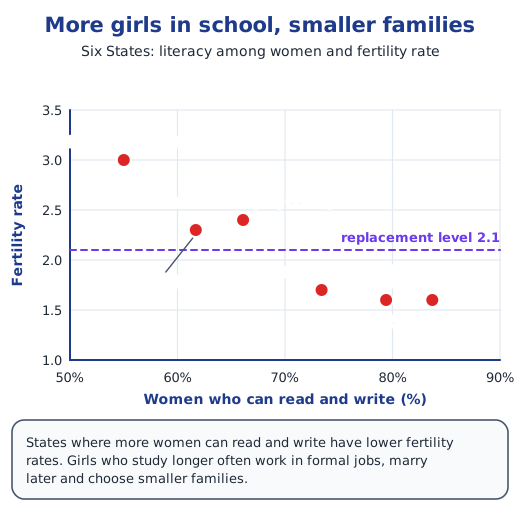
Fertility and literacy in six States (page 175). A sample report. Observation: as the share of women who can read and write goes up, the fertility rate goes down. Bihar has the lowest literacy among women (55 per cent) and the highest fertility rate (3.0); Delhi has the highest literacy (83.7 per cent) and one of the lowest fertility rates (1.6). Karnataka, Punjab and Delhi are below the replacement level of 2.1; Bihar, Uttar Pradesh and Jharkhand are above it. The link is strong but not perfect: Jharkhand has lower literacy than Uttar Pradesh but a slightly lower fertility rate, so other things, such as incomes and healthcare, matter too. Possible reasons: educated women tend to marry later, often take paid jobs, know more about health and family planning, and want fewer children so that each can study well.
If young people leave the villages (page 177). Farms have fewer young hands, so older people and women do more of the work, or some land is left unused. Many homes are left with only children and grandparents, and village schools may have fewer pupils. On the other hand, money sent home can pay for better houses, schooling and healthcare, and migrants who return may bring new skills and ideas.
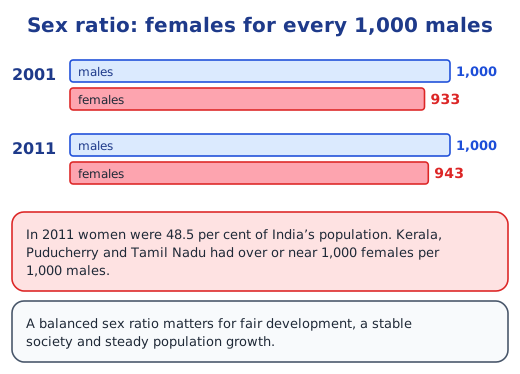
Kerala, Puducherry and Tamil Nadu (page 180). Possible reasons for sex ratios over or near 1,000: more women and girls are educated and have good healthcare, so fewer girls and women die young; there is less preference for sons and less neglect of daughters; women generally live longer than men; and in some places, such as Kerala, many men work in other States or abroad.
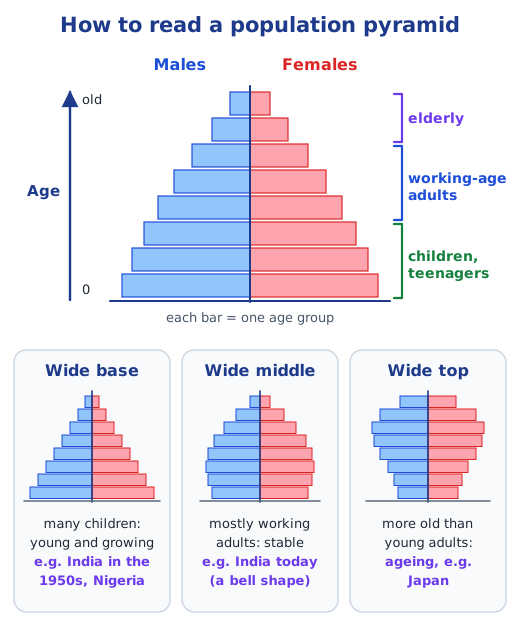
A replacement rate below 2 (page 183). Each new generation of children is smaller than the one before, so the base of the pyramid narrows while the top widens as people live longer; the shape becomes top-heavy. Yes, there can be fewer children than old people: Japan’s pyramid in Question 12 already shows this. Over time such a population ages and shrinks, unless many people migrate into the country.
What older people give (page 186). In ashrama dharma, life moves from brahmacharya (the student years) to grihastashrama (family life), vanaprastha (stepping back) and sanyasa (letting go). Older people in a neighbourhood look after grandchildren; teach cooking, farming, crafts, languages and prayers; tell stories and remember local history; guide families through festivals, weddings and rituals; give advice in family decisions; and often volunteer at places of worship or in community work.
Questions and activities (pages 187–190)
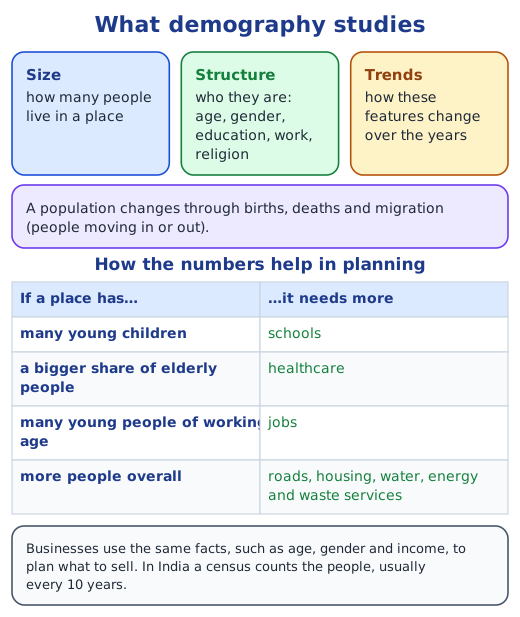
Q1. “Why is it important for a country to study its population through demography?” Demography tells a country how many people it has, who they are and how this is changing, so it can plan ahead. Many young children mean more schools and teachers; many young adults mean more jobs and training; more elderly people mean more hospitals and pensions; a growing town needs roads, houses, water, power and waste services. Businesses also use these facts to plan products. Without such information, resources would go to the wrong places.
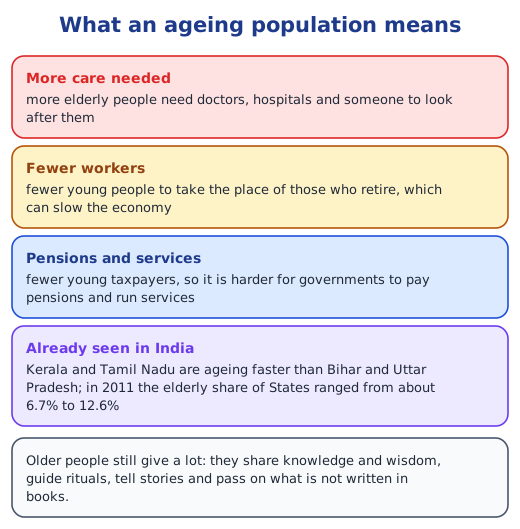
Q2. “How can a low fertility rate affect a country’s future economy and workforce?” Fewer children today mean fewer young workers tomorrow. As older workers retire, there may not be enough people to work on farms, in factories and in offices, so growth can slow. A shrinking number of taxpayers must support more elderly people who need pensions and healthcare. China shows this: after the One-Child Policy, the share of people over 65 is expected to climb from 14 per cent (2023) to 26 per cent (2050).
Q3. “Do you think a high birth rate is always good for a country? Why or why not?” No. A high birth rate gives a country many future workers, but only if those children are fed, schooled and later employed. If births are very high, schools, hospitals, housing, food and jobs cannot keep up, and many families stay poor; this is why China and India both ran campaigns for smaller families. Very frequent births also harm mothers’ health. A birth rate that keeps fertility near the replacement level, together with good education and healthcare, works better for most countries.
Q4. “Do you think it’s better to have more people or fewer people in a country? What are the challenges countries face in the case of a fast-growing or shrinking population?” Neither is good in itself; what matters is whether the number of people fits the country’s resources, and whether people are healthy, educated and working. A fast-growing population faces shortages of jobs, homes, schools, water and food, crowded cities and pollution. A shrinking population faces too few workers, an ageing society, high costs of pensions and care, and empty villages and towns, as in Japan, Italy and China today. A steady population with skilled people is easier to manage.
Q5. “How does the age structure of a country affect the kind of jobs and services it needs? Explain with examples.” A young country, such as India or Nigeria, needs schools, teachers, child healthcare and vaccination, and then large numbers of jobs and skills training for school-leavers. A country with many working-age adults needs factories, offices, transport and housing. An ageing country, such as Japan, needs hospitals, doctors and nurses for older people, caregivers, pensions, ramps and lifts, and machines to replace missing workers; this is why Japan uses robots and AI assistants in elderly care. Within India, Kerala and Tamil Nadu need more services for the elderly than Bihar and Uttar Pradesh.
Q6. “Why do you think families are generally getting smaller? Does having fewer children ensure better education and health for them? How does it affect families and society?” Families are getting smaller because girls study longer, more women work and marry later, life in cities is costly, more children survive so parents need not have many, and campaigns have encouraged small families. Fewer children do not by themselves make sure that each child is well educated and healthy, but they let parents spend more time and money on each one; good schools, healthcare and income still matter. Smaller families give each child more attention, but there are fewer brothers, sisters and cousins to share the care of elders. For society, population growth slows and, over time, the population ages.
Q7. “Observe the graph below showing changes in life expectancy across gender in India and answer the questions given below: a) Has the life expectancy in India increased? If yes, what could be the reasons? b) What was the life expectancy of males and females in 2010?”
(a) Yes. On the graph, life expectancy rises from about 41–43 years in 1950 to about 76 years for males and 80 for females by 2050 (projected). Reasons: better healthcare and hospitals, vaccines and antibiotics, oral rehydration solution, cleaner water and sanitation, better nutrition, fewer deaths of young children, and more education and income. The graph also shows that men lived slightly longer than women until the 1970s, but since about 1980 women have lived longer, and the gap is growing.
(b) Reading the graph, in 2010 life expectancy was about 65 years for males and about 68–69 years for females. These are readings from the points on the graph, so they are approximate.
Q8. “What is a demographic dividend, and how does it benefit a country? What do you think India needs to do today to make the most of its demographic dividend before 2050?” A demographic dividend is the chance of faster economic growth that comes from having a large, young, working-age population. More workers produce more goods and services, earn more and pay more taxes, which pay for schools, hospitals and roads. Before 2050 India needs to: give every child good schooling; train young people in useful skills; keep people healthy; create many more jobs in farms, factories, services and new businesses; help women work through daycare centres, flexible hours and safe transport; and start preparing for an older population with pensions and care for the elderly.
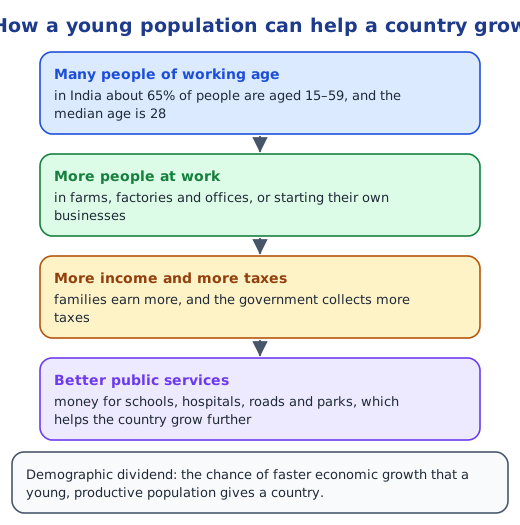
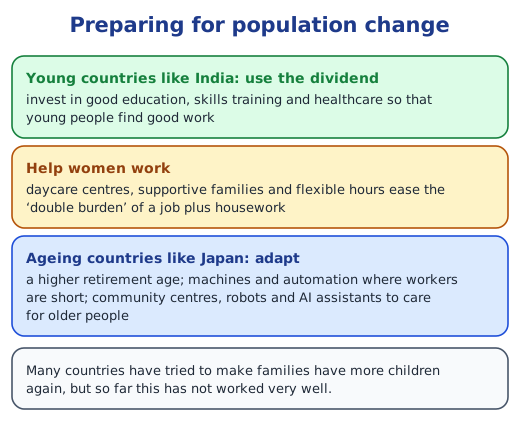
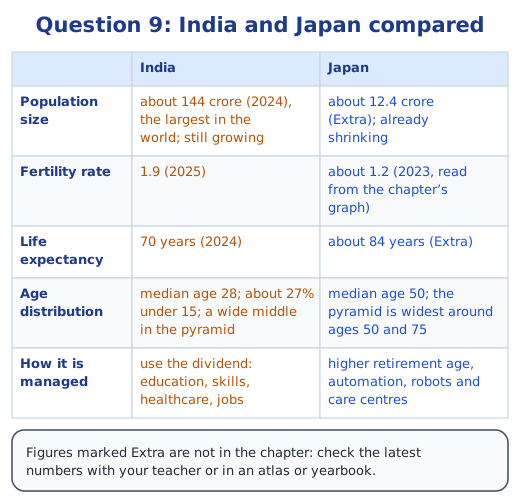
Q9. “Choose two countries (for example: India and Japan, or Nigeria and Italy). Find out their: Population size, Fertility rate, Life expectancy, Age distribution. How are they different? What might be the reasons behind these differences? For instance, find out how countries with ageing populations are managing this.” A sample comparison of India and Japan is below; the figures marked Extra are not in the chapter, so check the latest ones. India has far more people, more children per woman, a shorter life expectancy and a much younger population. Reasons: Japan grew richer earlier, so its death rate and then its birth rate fell decades before India’s; Japanese couples marry late and have few children; and excellent healthcare lets people live very long. Japan is managing by raising the retirement age, using automation and robots, and running community centres for older people.
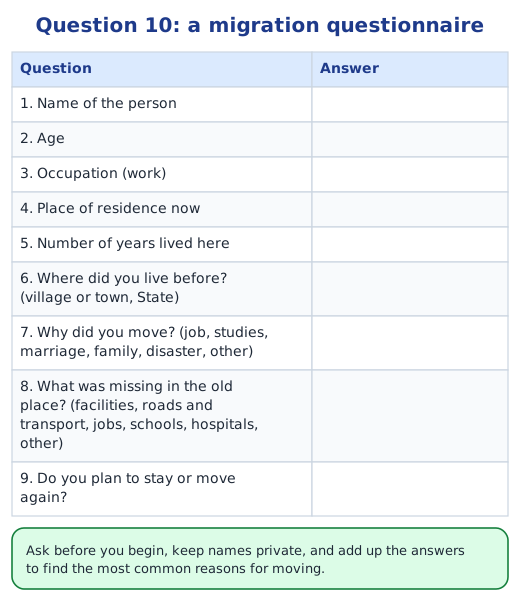
Q10. “Imagine you are a researcher who intends to study migration patterns in your locality. Make a questionnaire to collect data on the following questions. Name of the person; Age of the person; Occupation of the person; Place of residence; Number of years lived in the place; List the factors contributing to migration, such as lack of facilities, poor infrastructure, limited job opportunities and so on.” A sample questionnaire is below. Ask each person’s permission first, keep names private, and then count the answers to see where most people came from and why.
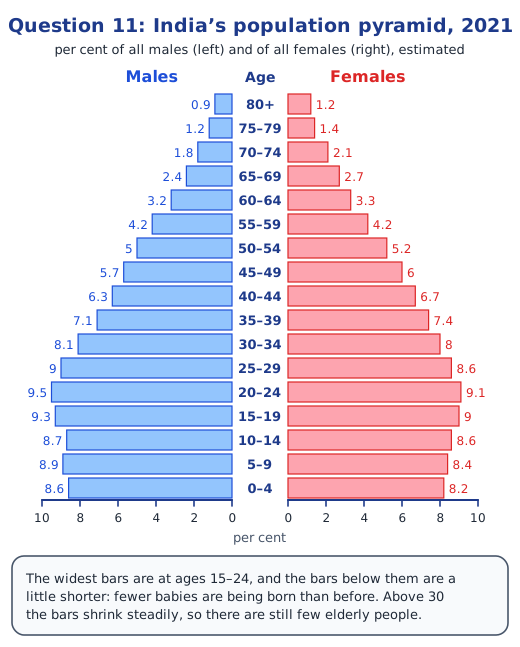
Q11. “Draw a population pyramid on graph paper for India using the data given in the following table.” (The table gives the percentage of males and of females in each five-year age group, estimated for 2021.) Steps: write the age groups up the middle, from 0–4 at the bottom to 80+ at the top; draw a horizontal scale from 0 to 10 per cent on each side, with the same spacing; draw each male bar to the left and each female bar to the right; then label the graph. Each column adds up to about 100, so the bars show shares of all males and of all females. What it shows: the bars are widest at ages 15–24, slightly shorter below (fewer babies than before) and narrow steadily above 30, so India is still young but its base has begun to shrink.
Q12. “Observe the population pyramid for Japan in 2023 below. What can you infer from this? Write your observations and share in the class.” The pyramid is narrow at the bottom and wide in the upper half, so Japan has few children and many older people: an ageing population. The widest bands are at ages of about 74–76 and about 49–52, people born in the late 1940s and the early 1970s, while the bars for children under 5 are less than half as long as the widest ones. At the top, the female side is much wider than the male side, so women live longer. With so few young people, Japan’s population is shrinking, it has fewer workers, and it needs more care for the elderly, which fits its median age of 50.
Practice
-
A country’s fertility rate is 1.4. What is most likely to happen to its population over time?
Show answer
Answer: (c) it will age and may shrink
-
Which of these helped child mortality in India fall from 271 to 28 per 1,000?
Show answer
Answer: (b) better healthcare, vaccines and clean water
-
A pyramid with its widest bars at ages 50–55 and 70–75 and a narrow base belongs to:
Show answer
Answer: (b) an ageing country such as Japan
-
Name one service a country with many elderly people needs more of, and one a country with many children needs more of.
Show answer
Answer: Elderly people need more hospitals, doctors and pensions; children need more schools, teachers and vaccination programmes.
-
Why might the population of a city grow even if its birth rate is low?
Show answer
Answer: Because people migrate to it from villages and smaller towns for jobs and education, and the newcomers add to its population.
Stuck on a question?
Take a photo and Lagnever AI explains it step by step. Try it for 7 days for ₹2.
Get it on Google Play Open in browser
For parents: after the trial, the plan renews monthly by UPI or card autopay. You can cancel anytime in the app.