
Class 8 Social Science Part 2 Chapter 6: Dynamics of Population Notes
This chapter in five lines
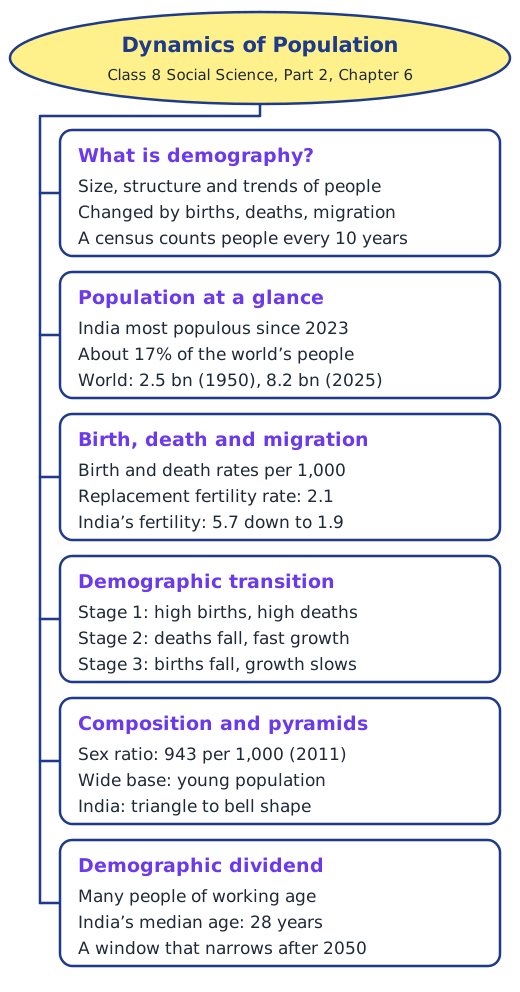
Dynamics of Population is about demography, the study of how many people live in a place, who they are and how this changes. Births, deaths and migration change a population, and countries pass through stages of demographic transition. India, now the most populous country, has a young population, a demographic dividend that narrows after about 2050.
What is this chapter about?
The chapter opens with a remark by Ban Ki-moon, a former Secretary-General of the United Nations: the ageing of populations will be one of the biggest social changes of this century. Its Big Questions ask what demography is, which ideas it uses, how the populations of India and the world have changed, and how these changes shape a society and its economy.
What is demography?
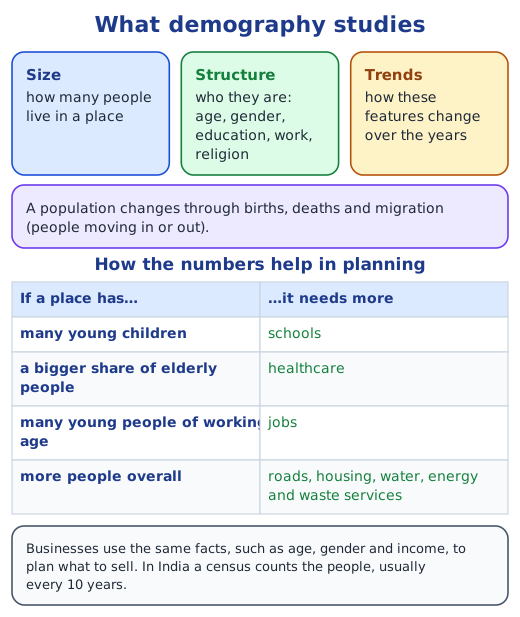
People differ in age, gender, education, work, religion and much more, and these features keep shifting as babies are born, people die and families move. Demography is the study of a population’s size, its make-up (its structure and composition) and the way these change over time. Governments use it to plan: many young children call for more schools, a bigger share of old people for more healthcare, and many young adults for more jobs. Businesses use it to decide what to make and sell. In India, the census, usually held every 10 years, is the official count of the people, with facts such as age, gender, education, languages, religion, family size and work.
How has the population changed?
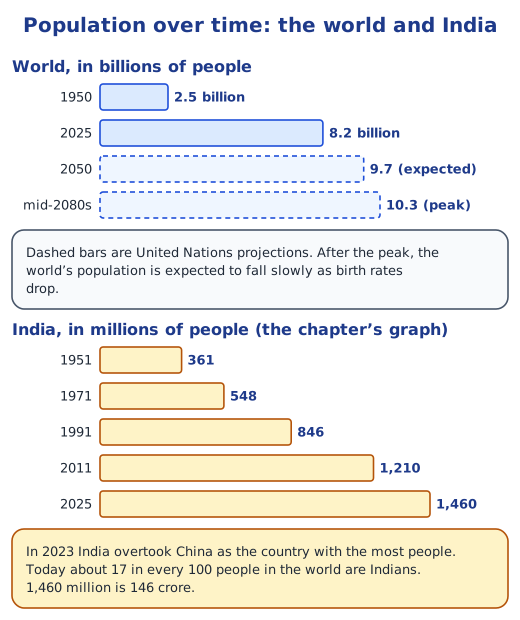
In 2023 India overtook China as the country with the most people, and about 17 in every 100 people on Earth are now Indians. The world had 2.5 billion people in 1950 and 8.2 billion in 2025; by 2050 it is likely to have about 9.7 billion. Most of this rise came from people living longer, thanks to antibiotics, vaccines, oral rehydration solution, and cleaner water and sanitation. Growth is now slowing: United Nations projections put the peak at about 10.3 billion in the mid-2080s, followed by a slow fall. China, Japan and Italy are already shrinking, India is still growing for now, and Nigeria and Ethiopia are growing fast.
What makes a population grow or shrink?
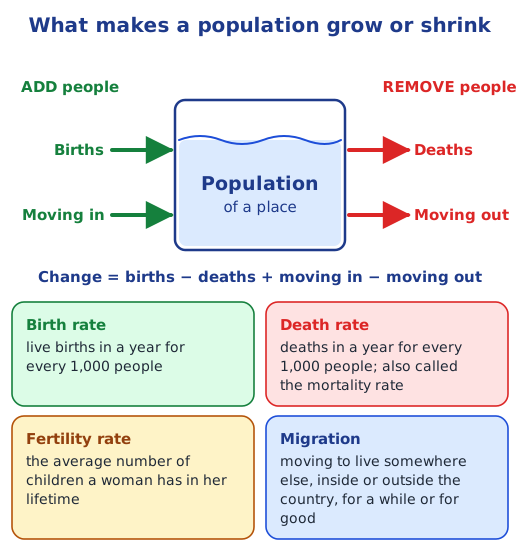
The population of a country today is the result of many years of births, deaths and people moving in or out. Demographers measure these with the birth rate and death rate (per 1,000 people in a year), the fertility rate (children per woman) and migration. A fertility rate of 2.1 is the replacement level: above it a population tends to grow, below it, to shrink. India’s fertility rate was 5.7 in 1950 and only 1.9 by 2025, while fewer child deaths and longer lives changed the picture too. Read birth rate, death rate and migration.
How do countries go through population change?
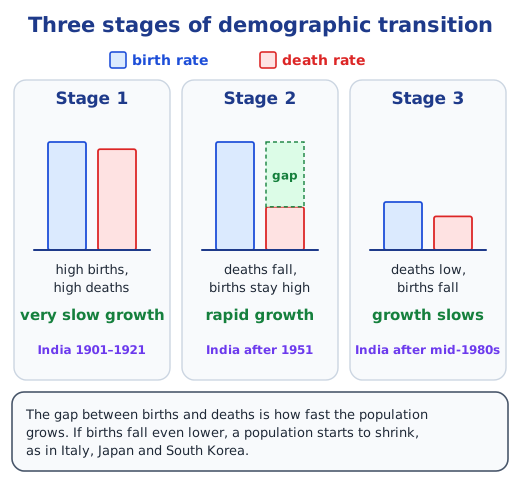
Just as a person grows from child to adult to elder, a country’s population passes through stages, called the demographic transition. In Stage 1, many babies are born and many people die, so numbers hardly grow (India, 1901–1921). In Stage 2, better healthcare cuts deaths while births stay high, so the population grows fast (India after 1951). In Stage 3, births fall too, with more education, city life, higher incomes and more women at work, so growth slows (India from the mid-1980s). If births drop even lower, a population shrinks, as in Italy, Japan and South Korea. Read demographic transition and population pyramids.
What is India’s population made of?
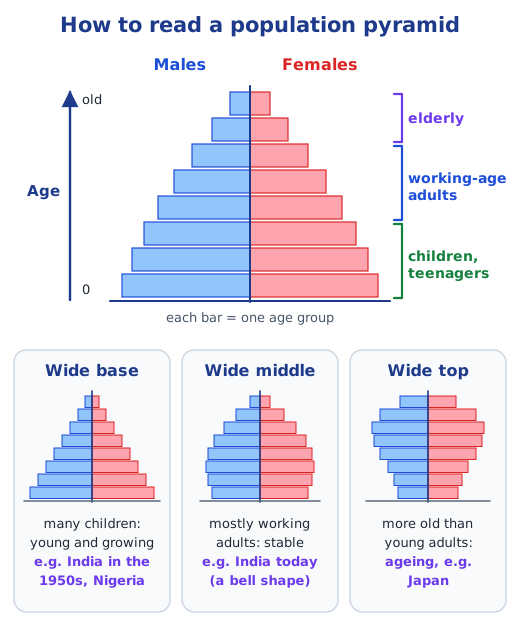
Uttar Pradesh alone has about 16 per cent of India’s people, and Maharashtra and Bihar about 9 per cent each, going by the chapter’s graph. Demographers also study the population’s composition: age, gender, work and education. The sex ratio, the number of females for every 1,000 males, rose from 933 in 2001 to 943 in 2011. A population pyramid shows the people in each age group, males on one side and females on the other. India’s was a narrow triangle in the 1950s; it now looks more like a bell, with fewer children at the base and a wide middle of working-age people.
India’s demographic dividend
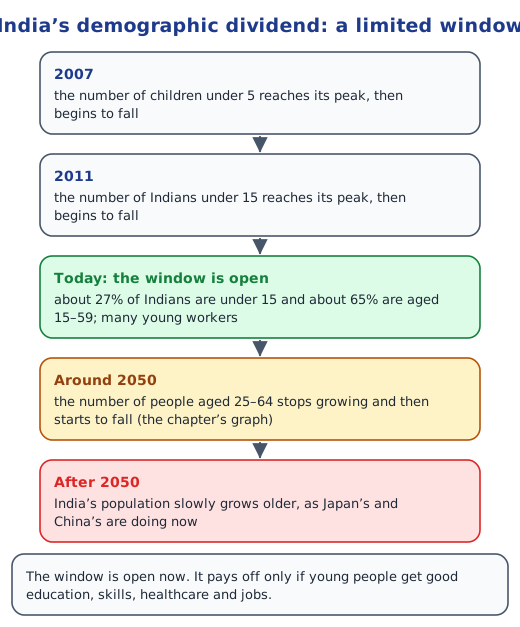
With a median age of 28, India is a young country: about 27 per cent of Indians are under 15 and about 65 per cent are aged 15–59. More people of working age can mean more work, more income and more taxes for schools, hospitals and roads. This chance is India’s demographic dividend. It will not last for ever: the number of children under 5 peaked in 2007, and after about 2050 India will start to grow older, as Kerala and Tamil Nadu already are. Read India’s demographic dividend.
Before we move on
Demography helps a country plan for its people. Populations change through births, deaths and migration, and move from high to low birth and death rates. India has to use its young workforce now, through education, skills, healthcare and jobs, before its population begins to age and, in the coming decades, to fall. Answers to every question are in the NCERT solutions for Part 2 Chapter 6.
Key terms
| Term | Meaning |
|---|---|
| Demography | The study of a population: its size, its make-up and how these change over time. |
| Census | The official count of all the people in a country, with facts about each of them; in India, usually every 10 years. |
| Birth rate | The number of live births in a year for every 1,000 people. |
| Fertility rate | How many children, on average, a woman has during her life. |
| Replacement level fertility | A fertility rate of 2.1, just enough for children to take their parents’ place. |
| Death rate (mortality rate) | How many people die in a year for every 1,000 people. |
| Child mortality | Deaths of children under 5 for every 1,000 live births. |
| Life expectancy | The average number of years a newborn can expect to live if today’s conditions continue. |
| Migration | Moving to live somewhere else, inside the country or abroad, for a short time or for good. |
| Demographic transition | The step-by-step shift of a population as first its death rate and then its birth rate fall from high to low. |
| Sex ratio | The number of females for every 1,000 males. |
| Population pyramid | A graph of a population by age group and gender, males on one side and females on the other. |
| Working-age population | People aged roughly 15 to 64, who do most of the work in an economy. |
| Youth bulge | A large share of young people, aged about 16 to 30, in a population. |
| Demographic dividend | The chance of faster economic growth that a young, productive population gives a country. |
Topics in this chapter
Practice
-
What is the replacement level fertility rate?
Show answer
Answer: (c) 2.1
-
In which year did India become the world’s most populous country?
Show answer
Answer: (c) 2023
-
Sex ratio is the number of:
Show answer
Answer: (b) females for every 1,000 males
-
In Stage 2 of demographic transition:
Show answer
Answer: (b) the death rate falls but the birth rate stays high
-
A population pyramid with a wide top shows:
Show answer
Answer: (c) an ageing population
-
India’s median age, as given in the chapter, is about:
Show answer
Answer: (b) 28 years
Questions students ask
What are the main topics of Class 8 Social Science Part 2 Chapter 6?
What demography is and why it matters; the census; how the populations of India and the world have changed; birth, fertility and death rates and migration; the three stages of demographic transition; sex ratio and population pyramids; and India’s demographic dividend and population ageing.
Is Dynamics of Population in the new NCERT Class 8 Social Science book?
Yes. It is Chapter 6 of Exploring Society: India and Beyond, Grade 8 Part 2, in the theme Economic Life Around Us, on pages 167 to 190.
What is the difference between birth rate and fertility rate?
The birth rate counts live births in a year for every 1,000 people in the whole population. The fertility rate tells us how many children, on average, a woman has during her life. When the fertility rate falls, the birth rate falls too.
Why is India’s demographic dividend called a limited window?
Because India’s young population will not stay young. The number of children has already started to fall, and after about 2050 the working-age group stops growing and the population starts to age.
Stuck on a question?
Take a photo and Lagnever AI explains it step by step. Try it for 7 days for ₹2.
Get it on Google Play Open in browser
For parents: after the trial, the plan renews monthly by UPI or card autopay. You can cancel anytime in the app.