
Demographic transition and population pyramids
Answer in short
Demographic transition is the change a country’s population goes through as birth and death rates fall: first both are high, then deaths fall while births stay high, then births fall too. A population pyramid shows the people in each age group by gender; India’s has changed from a narrow triangle to a bell shape.
Stuck on a question? Take a photo and Lagnever AI explains it step by step. Try it for 7 days for ₹2. Get it on Google Play
Countries grow up too
A person passes through childhood, adulthood and old age. A country’s population also changes with time, as its birth and death rates change. Demographers have noticed that these changes follow a pattern, called the demographic transition. It is shaped by economic growth, better healthcare and education, and women having a greater say in decisions at home.
The three stages
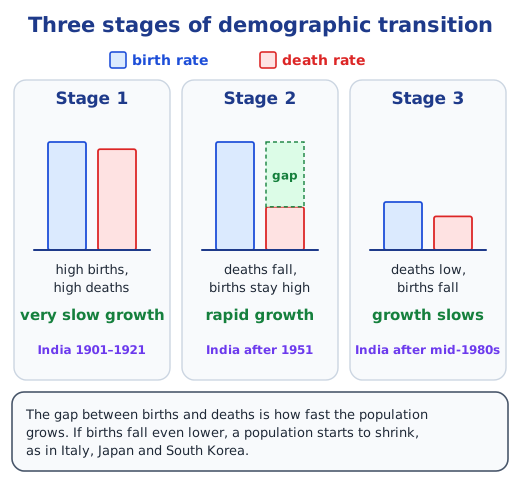
Stage 1: high birth rate, high death rate. Many babies are born, but many people also die, so the population grows very slowly or not at all. India was in this stage from 1901 to 1921, when healthcare was poor and few people could read and write.
Stage 2: the death rate falls, the birth rate stays high. As a country develops, better healthcare saves lives and the death rate drops. Families still have many children, so the gap between births and deaths widens and the population shoots up. India’s population grew rapidly after 1951.
Stage 3: the death rate is low and the birth rate falls. As more people live in cities, earn more and study longer, and as more women go out to work, families have fewer children and growth slows. If fertility falls very low, the population starts to shrink, as it already has in Italy, Japan and South Korea.
Where is India now?
India’s fertility rate began to fall after the mid-1980s and is now 1.9, below the replacement level of 2.1. So India is in Stage 3: its population is still growing, but more slowly, because many people born in earlier decades are now adults with families of their own.
How is India’s population spread and made up?
India’s people are spread unevenly across the States. Going by the chapter’s graph, Uttar Pradesh has about 16 per cent of the country’s population, Maharashtra and Bihar about 9 per cent each, and West Bengal about 8 per cent. Beyond where people live, demographers study population composition: features such as age, gender, work and education.
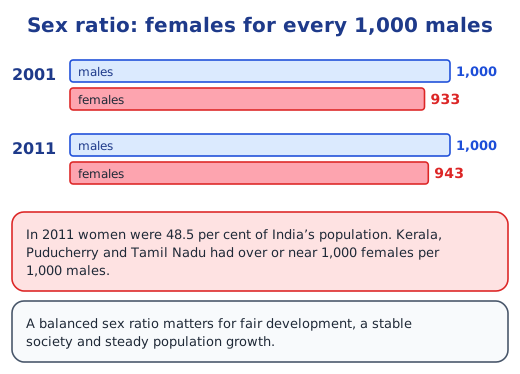
The sex ratio, the number of females for every 1,000 males, measures the balance between women and men. It also reflects a society’s attitudes and conditions. India’s sex ratio was 933 in the 2001 Census and improved to 943 in 2011, when women made up 48.5 per cent of the population. Kerala, Puducherry and Tamil Nadu had sex ratios over or close to 1,000. A balanced sex ratio matters for fair development and a stable society.
How do you read a population pyramid?
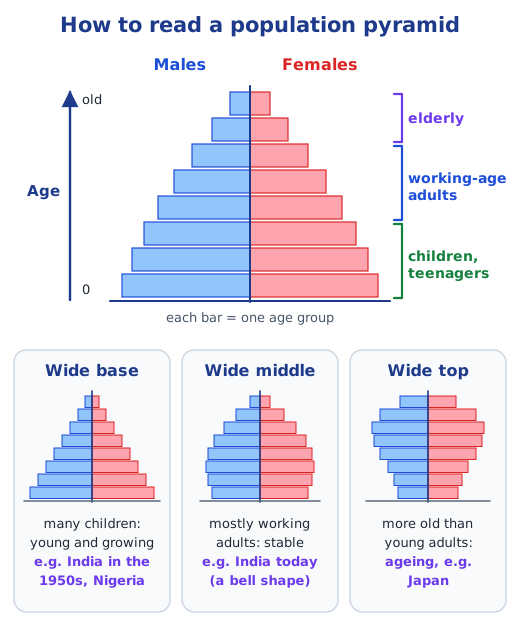
A population pyramid, also called a population structure diagram, is a graph of how many people there are in each age group. Males are drawn on one side and females on the other. The bottom bars show children and teenagers, the middle bars working-age adults and the top bars elderly people.
- A wide base means many children are being born: the population is young and growing, as in Nigeria.
- A wide middle means most people are working adults: the population is fairly stable.
- A wide top means there are more older people than young adults: the population is ageing, as in Japan.
The name ‘pyramid’ is not quite exact. On paper the graph is flat, more like a triangle whose sides have been pushed out or pulled in.
How has India’s pyramid changed?
In the 1950s India’s pyramid was a narrow triangle. Families had many children, so the base was broad, and few people reached old age, since life expectancy was only about 30–35 years.
Today the pyramid looks more like a bell. Its base has become narrower, because families have fewer children. Its middle, the people of working age, has become much wider. Its top is slowly widening too, as better healthcare, food and living conditions help people live longer. India’s population has gone from young and fast-growing to more balanced, and in future it may slowly age, as Japan and China are doing now.
If fertility stayed below 2 for a long time, each new generation would be smaller than the last. The base would keep shrinking until there were fewer children than old people, and the population would grow older and smaller.
Read on: birth rate, death rate and migration, India’s demographic dividend, the chapter notes and the NCERT solutions.
Practice
-
In which stage of demographic transition does a population grow fastest?
Show answer
Answer: (b) Stage 2
-
India’s sex ratio in the 2011 Census was:
Show answer
Answer: (b) 943
-
A population pyramid with a wide base shows:
Show answer
Answer: (a) many children and a growing population
-
When did India enter Stage 2 of demographic transition, and why?
Show answer
Answer: After 1951. Better healthcare brought the death rate down while the birth rate stayed high, so the population grew rapidly.
-
What will a population pyramid look like if the fertility rate stays below 2?
Show answer
Answer: Its base will narrow, because each generation of children is smaller than the one before, and its top will widen as people live longer. In time the population ages and shrinks.
Questions students ask
What is demographic transition?
It is the pattern of change that populations go through as countries develop: from high birth and death rates, to falling death rates, to falling birth rates. It explains why a population first grows slowly, then fast, then slowly again.
What is a population pyramid?
A graph showing how many people are in each age group, with males on one side and females on the other. Children are at the bottom, adults in the middle and older people at the top.
Why has India’s population pyramid changed shape?
Families have fewer children than before, so the base has narrowed; many people born in earlier decades are now adults, so the middle is wide; and people live longer, so the top is slowly widening.
What is sex ratio?
The number of females for every 1,000 males in a population. India’s was 933 in 2001 and 943 in 2011, when women made up 48.5 per cent of the population.
Stuck on a question?
Take a photo and Lagnever AI explains it step by step. Try it for 7 days for ₹2.
Get it on Google Play Open in browser
For parents: after the trial, the plan renews monthly by UPI or card autopay. You can cancel anytime in the app.