
Pie charts: sharing 360° in proportion
Answer in short
A pie chart is a circle divided into slices that show the parts of a whole. Each slice’s angle is proportional to its share: angle = (part ÷ total) × 360°. For 40 students scoring grades A to E as 12, 10, 8, 6 and 4, the slices are 108°, 90°, 72°, 54° and 36°, which add up to 360°.
Stuck on a question? Take a photo and Lagnever AI explains it step by step. Try it for 7 days for ₹2. Get it on Google Play
A slice of the pie
A pie chart is a circle cut into slices, like a pie shared out at home. Each slice stands for one part of a whole, and the bigger the part, the bigger the slice. Because the whole circle turns through 360°, the angle at the centre of each slice must be proportional to the part it shows. That makes a pie chart a neat use of dividing a whole in a given ratio.
Finding the angles
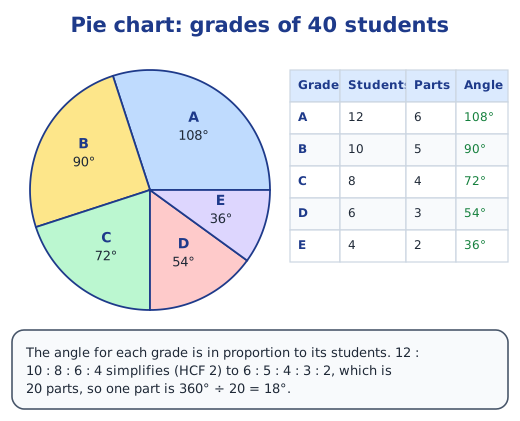
The book’s example has 40 students and their grades:
| Grade | A | B | C | D | E |
|---|---|---|---|---|---|
| Students | 12 | 10 | 8 | 6 | 4 |
So 360° must be split in the ratio 12 : 10 : 8 : 6 : 4. First simplify. The HCF of all five numbers is 2, so the ratio simplifies to 6 : 5 : 4 : 3 : 2. That is 6 + 5 + 4 + 3 + 2 = 20 parts, and one part is 360° ÷ 20 = 18°. So grade A gets 6 × 18° = 108°, B gets 90°, C 72°, D 54° and E 36°. Add them as a check: 108 + 90 + 72 + 54 + 36 = 360.
The general rule is angle = (part ÷ total) × 360°. For percentages it is even simpler: 1% of the circle is 3.6°, so 50% is 180°, 25% is 90°, 15% is 54° and 10% is 36°.
Drawing it, step by step
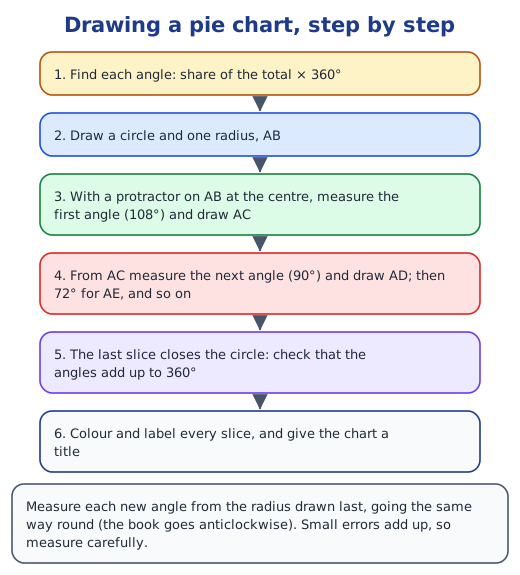
- Draw a circle with a compass and mark one radius, AB.
- Place the protractor with its centre on A, the centre of the circle, and its base on AB. Measure 108° (anticlockwise, as the book does) and draw the new radius AC. That slice is grade A.
- From AC, measure 90° and draw AD for grade B.
- From AD, measure 72° and draw AE for grade C.
- Carry on for 54° (D) and 36° (E). The last slice should end exactly at AB.
- Colour each slice, label it, and give the chart a title.
Small errors in measuring add up as you go round, so measure each angle carefully from the line drawn just before it.
Reading a pie chart
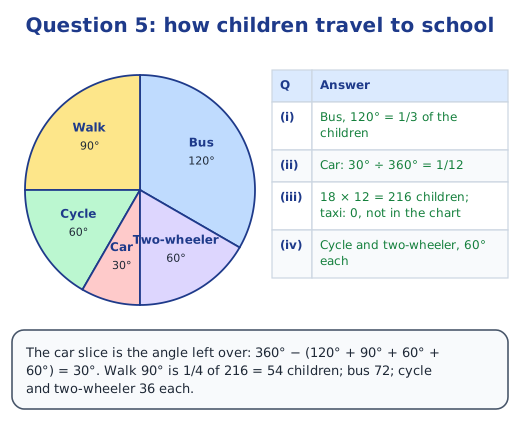
A pie chart can also be read backwards. In a survey of how children travel to school, the slices are bus 120°, walk 90°, cycle 60° and two-wheeler 60°, and the car slice is what is left: 360° − 330° = 30°. The bus slice is the biggest, a third of the circle, so the bus is the most common way. The car slice is 30° ÷ 360° = 1/12 of the children. If 18 children come by car, the survey had 18 × 12 = 216 children, and the 90° walking slice stands for a quarter of them, 54 children. Cycle and two-wheeler have equal slices, so equal numbers use them.
Try one yourself
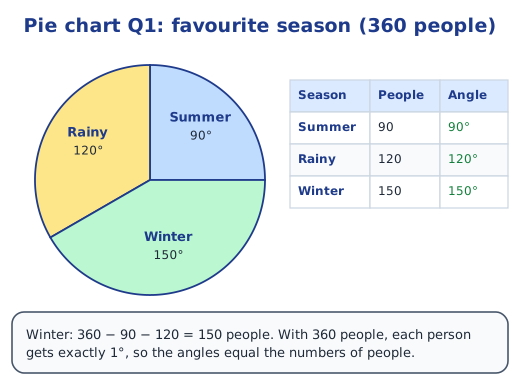
In a survey of 360 people, 90 like summer, 120 the rainy season and the rest, 150, winter. With 360 people, each person is exactly 1°, so the slices are 90°, 120° and 150°. A survey of your own class, with each student choosing one favourite subject, makes a good chart to draw.
More from this chapter: ratios with more than two terms, inverse proportion, the chapter notes and the NCERT solutions.
Practice
-
In a pie chart, a group that is half of the total gets an angle of:
Show answer
Answer: (c) 180°
-
A slice of 90° shows what fraction of the whole?
Show answer
Answer: (c) 1/4
-
15% of viewers like news. The news slice is:
Show answer
Answer: (c) 54°
-
60 students: 30 like cricket, 20 football and 10 kabaddi. Find the angles.
Show answer
Answer: Cricket 30 ÷ 60 × 360° = 180°, football 20 ÷ 60 × 360° = 120°, kabaddi 10 ÷ 60 × 360° = 60°. Check: 180 + 120 + 60 = 360.
-
In a pie chart of 216 children, the walking slice is 90°. How many children walk?
Show answer
Answer: 90° is a quarter of 360°, so a quarter of the children walk: 216 ÷ 4 = 54 children.
Questions students ask
How do you calculate the angles for a pie chart?
Divide each value by the total and multiply by 360°. It is quicker to simplify the ratio of the values first: 12 : 10 : 8 : 6 : 4 becomes 6 : 5 : 4 : 3 : 2, which is 20 parts, so each part is 360° ÷ 20 = 18°, and the angles are 108°, 90°, 72°, 54° and 36°.
How do you draw a pie chart?
Draw a circle and one radius. Put the protractor’s centre on the centre of the circle and measure the first angle from that radius, then draw the new radius. Measure the next angle from that new line, and so on. The last slice should close the circle exactly. Then colour, label and title the chart.
When is a pie chart useful?
When the data are parts of one whole, such as the grades in a class, how children travel to school or how a day is spent. It shows at a glance which part is largest and how big each part is compared with the whole.
Stuck on a question?
Take a photo and Lagnever AI explains it step by step. Try it for 7 days for ₹2.
Get it on Google Play Open in browser
For parents: after the trial, the plan renews monthly by UPI or card autopay. You can cancel anytime in the app.