
NCERT Solutions Class 6 Maths Chapter 4: Data Handling and Presentation
Answers to every “Figure it Out” and in-text question in Chapter 4, Data Handling and Presentation, of Ganita Prakash (Reprint 2026-27), with the pictographs and bar graphs drawn. The page numbers match the book, and the answers are checked against NCERT’s own solutions printed with the chapter; where we differ, we explain why. Tasks about your own class or surroundings have sample answers. Short notes: Chapter 4 notes.
Figure it Out: collecting data (pages 75–76)
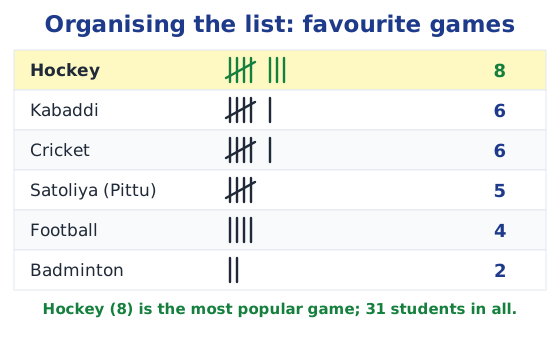
1. Organise the list in a table with tally marks for each game, then compare the frequencies.
2. Counting the 31 names gives hockey 8, kabaddi 6, cricket 6, satoliya (pittu) 5, football 4 and badminton 2. The most popular game is hockey.
3. Ask each classmate, tally the answers and find the game with the highest frequency.
4. a. ✓ (ask classmates); b. ✗ (a known fact: 1947); c. ✓ (measure and record); d. ✗ (a known fact: New Delhi).
Figure it Out: Shri Nilesh’s sweets (pages 76–77)
1. a. 6 chose jalebi; b. barfi was chosen by 3; c. 13 chose gujiya; d. rasgulla was chosen by 7; e. 9 chose gulab jamun.
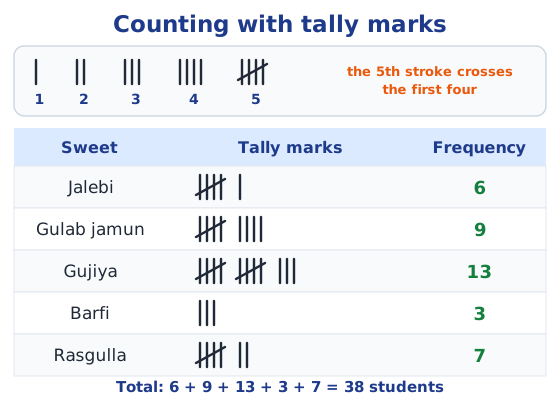
2. No. The table tells how many students want each sweet, but not which student wants which. He could list the students’ names under each sweet, or keep a list of each name with its choice.
Figure it Out: shoe sizes, trees and letters (pages 77–79)
1. a. Largest size 7; b. smallest size 3; c. 10 students wear size 5; d. 15 students wear sizes larger than 4 (10 + 4 + 1).
2. In ascending order, equal values sit together, so the largest, smallest and counts can be read off quickly.
3. Yes: a frequency table with tally marks for each size, or descending order.
4. Trees (sample): neem 7, peepal 3, mango 5, banyan 1, ashoka 5. Most: neem; fewest: banyan; equal numbers: mango and ashoka (5 each).
5. Letters (sample): c 14, e 52, i 33, r 29, x 1. a. e; b. x; c. x, c, r, i, e. Most classmates get this order because e is the most common letter in English and x one of the rarest, so any long English text shows the same pattern. d–f. Process: underline each target letter, put a tally mark in the table for it, count the tallies; for another article, use the same steps.
Pictographs: in-text questions (pages 79–83)
Modes of travel: school bus is used by the most students (11) and cycle by the least (3).
Absent and present students: with one symbol per student, the ‘present’ data (20 to 35 per class) would need about 200 symbols, too many to draw. Jarina’s key of 5 and Sangita’s key of 10 (with half symbols) solve this.
33 or 27 students: with one symbol = 10 and half a symbol = 5, 33 is three symbols and 3 more, and 27 is two and a half symbols and 2 more. The extra 3 or 2 cannot be shown exactly; you would need a smaller key, such as 1 symbol = 1 student, or parts of a symbol that are hard to read.
Figure it Out: pictographs (pages 83–85)
1. Books borrowed (Monday 5, Tuesday 4, Wednesday 2, Thursday 0, Friday 5, Saturday 8): a. Thursday (no books). b. 24 books. c. Saturday (8 books): students may borrow books to read over the Sunday holiday.
2. Kites (one symbol = 100 kites):
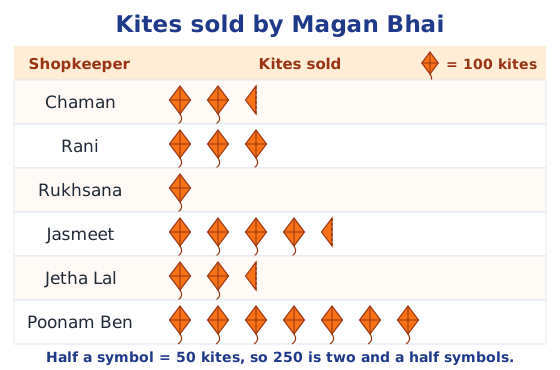
a. 3 symbols. b. Poonam Ben (700). c. Jasmeet (450, against Chaman’s 250). d. Yes: double Rani’s 300 is 600, and Poonam Ben bought 700.
Bar graphs: in-text questions (pages 86–89)
Absent students: 1. 5 students in Class 2. 2. Class 8 (7). 3. Class 5 (none absent).
Traffic (Figure it Out, page 88):
- About 150 + 1,200 + 1,000 + 800 + 700 + 600 = 4,450 vehicles.
- 6 to 7 a.m. is early morning; few people have left home, and shops and offices are closed.
- 7 to 8 a.m. is the rush hour, when many people travel to work, school and college at the same time.
- After 8 a.m., most people have already reached work or school, so fewer vehicles travel each hour.
Population of India: sample questions: In which decade did the population grow most? When did it first cross 50 crore? It rose by 102 − 36 = 66 crore in 50 years. By decade: 1951–61, 8 crore; 1961–71, 10; 1971–81, 14; 1981–91, 16; 1991–2001, 18 crore.
Drawing bar graphs: in-text questions (pages 89–93)
Imran’s family: 1. Most on food (₹3,400), next on house rent (₹3,000). 2. Yes, electricity (₹400) is exactly half of education (₹800). 3. Yes, education (₹800) is less than one-fourth of food (₹3,400 ÷ 4 = ₹850).
Figure it Out: bar graphs (pages 93–100)
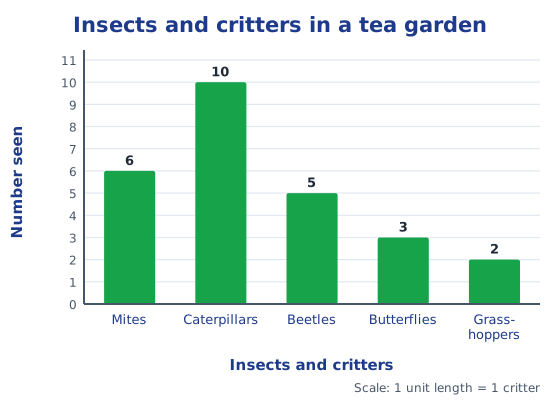
1. Samantha’s insects (1 unit = 1 critter):
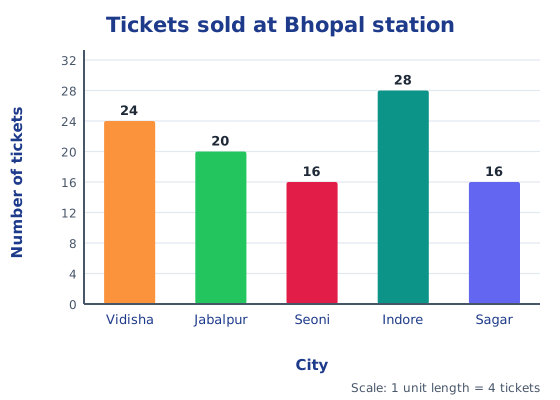
2. Pooja’s tickets: a. 24; b. 20; c. 6 units show 24, so 1 unit = 4 tickets; d. Sagar (16) needs 4 units; e. mark 0, 4, 8, 12, 16, 20, 24, 28, 32 on the vertical axis; f. Seoni (4 units = 16) is correct, but Indore is too short: 28 tickets need 7 units.
3. Chinu’s transport list:
| Means of transport | Frequency |
|---|---|
| Bike | 13 |
| Scooter | 9 |
| Bicycle | 8 |
| Auto rickshaw | 8 |
| Car | 6 |
| Bus | 4 |
| Bullock cart | 2 |
| Total | 50 |
b. Bike. c. Make a table of the kinds of vehicles before 9 a.m.; stand at a safe spot; put a tally mark against each vehicle as it passes until 10 a.m.; then count the tallies.
4. Die rolled 30 times (sample): 1 came 4 times, 2 six times, 3 five times, 4 three times, 5 seven times and 6 five times. a. 4; b. 5; c. 3 and 6 (5 times each). Your results will differ, since each roll is a matter of chance.
5. Bumrah’s wickets:
a. In how many of his last 30 matches he took 0, 1, 2, …, 7 wickets. b. For example, ‘Wickets taken by Jaspreet Bumrah in his last 30 matches’. c. For example, 3 wickets is the most common result (8 matches), and he took 7 wickets only once. d. 3 matches. e. No. Adding 0 + 1 + … + 7 = 28 ignores how many matches each number happened in; for example, 3 wickets in each of 8 matches is already 24 wickets. f. Multiply each number of wickets by its number of matches and add: 0 × 2 + 1 × 4 + 2 × 6 + 3 × 8 + 4 × 3 + 5 × 5 + 6 × 1 + 7 × 1 = 90 wickets.
6. Tractors (A 6, B 5, C 8, D 3, E 6): a. Village D. b. Village C. c. 3 more. d. Yes: D has 3 and E has 6, and 3 is half of 6.
7. Girl students (one symbol = 4 girls; Classes 1 to 8 have 24, 18, 20, 14, 10, 16, 12 and 6): a. Class 8 (6). b. 16 − 10 = 6. c. Class 2 would have 20 girls, so its half symbol would become a full symbol (5 full symbols). d. 12 girls.
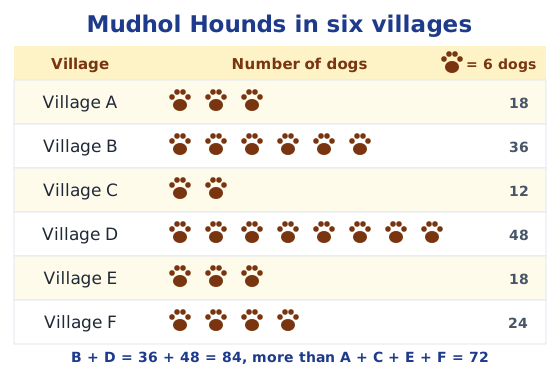
8. Mudhol Hounds: a. One symbol = 6 dogs, because every number is a multiple of 6. b. 6 symbols for Village B. c. Yes: B and D have 36 + 48 = 84 dogs, more than the other four villages’ 18 + 12 + 18 + 24 = 72.
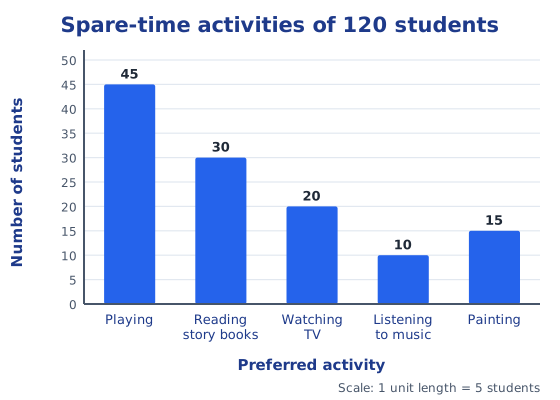
9. Spare-time activities (1 unit = 5 students): bar lengths 9, 6, 4, 2 and 3 units. After playing, reading story books (30) is the most preferred.
10. Saplings (Monday about 50, Tuesday 40, Wednesday 30, Thursday 40, Friday 50, Saturday 60, Sunday 40): a. 70 (30 + 40). b. About 310. Monday’s bar ends a little above the 50 line (about 52), so the total is 310 to 312; NCERT’s key gives 310. c. Greatest on Saturday, least on Wednesday. Possible reasons: Saturday may be a half day or a holiday with more helpers; Wednesday may have had rain, a test or fewer saplings delivered. To check, ask the teachers who organised the planting, look at attendance and weather records, or keep a note of these details next time.
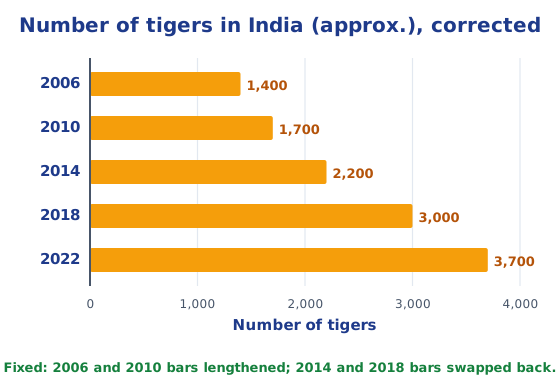
11. Tigers: compared with the table, the 2006 bar shows about 800 instead of 1,400 and the 2010 bar about 1,500 instead of 1,700, and the 2014 and 2018 bars are swapped (2014 shows about 3,000 and 2018 about 2,200). Only 2022 (3,700) is right. The corrected graph:
Artistic and aesthetic considerations (pages 101–105)
Everest and Kosciuszko: 8,848 − 2,228 = 6,620 m taller. Denali and Kilimanjaro: 6,194 − 5,895 = 299 m, so they are not very different. 5,642 × 2 = 11,284, so Everest (8,848 m) is not twice as tall as Elbrus, though the infographic makes it look so. (The book spells the Australian peak ‘Koscuiszko’; the usual spelling is Kosciuszko.)
Figure it Out
- Vertical bars, because heights are measured upwards from the ground, so columns look like people standing.
- Horizontal bars, because a river’s length lies along the ground. Extra (approximate lengths, which vary between sources): Africa, the Nile, about 6,650 km; South America, the Amazon, about 6,400 km; Asia, the Yangtze, about 6,300 km; North America, the Mississippi with the Missouri, about 6,275 km; Europe, the Volga, about 3,530 km; Australia, the Murray, about 2,500 km; Antarctica has no large rivers. The longest rivers are in Africa and South America.
For more practice, read tally marks, what is a pictograph and how to draw a bar graph.
Practice
-
In a pictograph, one symbol = 5 students. How many symbols show 35 students?
Show answer
Answer: (b) 7
-
A bar graph uses 1 unit length = 100 vehicles. A bar of 12 units shows:
Show answer
Answer: (c) 1,200 vehicles
-
The shoe sizes 3, 4, 5, 6 and 7 occur 3, 9, 10, 4 and 1 times. How many students wear a size larger than 4?
Show answer
Answer: (c) 15
-
Find the total wickets: 2 matches with 0 wickets, 4 with 1, 6 with 2 and 8 with 3.
Show answer
Answer: 0 × 2 + 1 × 4 + 2 × 6 + 3 × 8 = 0 + 4 + 12 + 24 = 40 wickets.
-
Why must the markings on a bar graph start from zero?
Show answer
Answer: So that the length of each bar is in proportion to its value. If the scale starts higher, small differences look large and the graph misleads.
Stuck on a question?
Take a photo and Lagnever AI explains it step by step. Try it for 7 days for ₹2.
Get it on Google Play Open in browser
For parents: after the trial, the plan renews monthly by UPI or card autopay. You can cancel anytime in the app.