
How to draw a bar graph
Answer in short
To draw a bar graph, draw a horizontal and a vertical line, write the categories along one and the values along the other, and choose a scale so the graph fits, marked from zero. Then draw bars of equal width with equal gaps, each as long as its value. With 1 unit = ₹200, ₹3,400 needs 17 units.
Stuck on a question? Take a photo and Lagnever AI explains it step by step. Try it for 7 days for ₹2. Get it on Google Play
Why bar graphs?
Pictographs are fun, but with lots of data they take long to draw and cannot show every value exactly. A bar graph shows data with bars of equal width, placed with equal gaps, where the length or height of each bar gives the value. You can compare categories at a glance and spot the largest and smallest.
Steps to draw a bar graph
- Draw two lines: a horizontal line and a vertical line meeting at a corner.
- Place the categories: write them along one line, equally spaced.
- Choose a scale: decide how many items one unit length stands for, so the longest bar fits. Mark the scale on the other line, starting from zero.
- Work out bar lengths: length in units = value ÷ scale.
- Draw the bars: same width, same gaps, each as long as its value.
- Label both lines, write the scale and add a title.
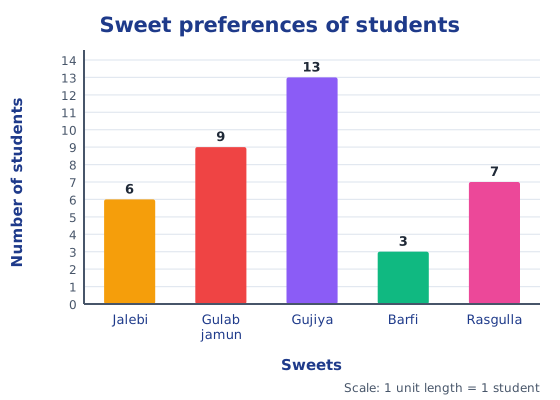
Example 1: sweets (1 unit = 1 student)
Shri Nilesh’s class chose sweets: jalebi 6, gulab jamun 9, gujiya 13, barfi 3 and rasgulla 7. The numbers are small, so 1 unit length = 1 student works well.
Example 2: runs (1 unit = 10 runs)
Smriti scored 80, 50, 10, 100, 90, 0, 90 and 50 runs in eight matches. Marking every run from 0 to 100 would be tedious, so use 1 unit length = 10 runs: 80 runs is 8 units and 100 runs is 10 units. Match 6, with 0 runs, has no bar at all.
Example 3: family expenses (1 unit = ₹200)
| Item | Expenditure | Bar length (÷ 200) |
|---|---|---|
| House rent | ₹3,000 | 15 units |
| Food | ₹3,400 | 17 units |
| Education | ₹800 | 4 units |
| Electricity | ₹400 | 2 units |
| Transport | ₹600 | 3 units |
| Miscellaneous | ₹1,200 | 6 units |
The graph shows that Imran’s family spends most on food and next most on house rent. Electricity (₹400) is exactly half of education (₹800), and education is less than one-fourth of food, since one-fourth of ₹3,400 is ₹850.
Reading a bar graph
In a Delhi traffic study, a bar graph with 1 unit = 100 vehicles showed about 150 vehicles from 6 to 7 a.m., 1,200 from 7 to 8, 1,000 from 8 to 9, 800 from 9 to 10, 700 from 10 to 11 and 600 from 11 to noon: about 4,450 in all. The longest bar, 7 to 8 a.m., is the rush hour, when people head to work and school.
Spotting mistakes
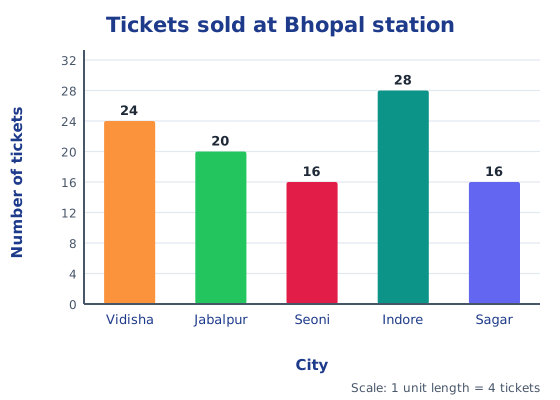
Always check bars against the data. In a graph of tickets sold at Bhopal station, the bar for Vidisha was 6 units for 24 tickets, so the scale was 1 unit = 4 tickets; Indore’s 28 tickets should then be 7 units, not shorter.
Vertical or horizontal?
Both are correct, but choose what suits the data. Heights rise from the ground, so the tallest mountain on each continent looks natural as vertical bars, a column graph. Lengths lie along the ground, so river lengths suit horizontal bars.
Beware of misleading pictures
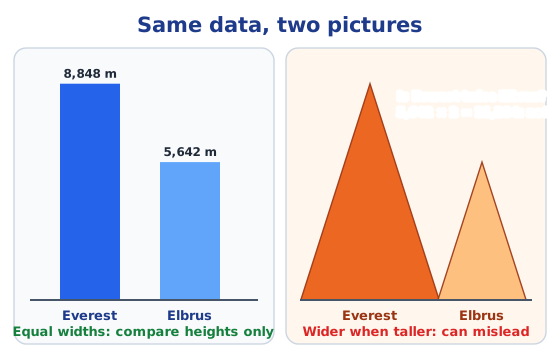
Infographics decorate graphs with artistic images. They catch attention, but can mislead. Drawn as triangles, a taller mountain also becomes wider and looks far bigger than it is. Everest (8,848 m) is not twice as tall as Elbrus (5,642 m): 5,642 × 2 = 11,284.
To organise data before graphing, read tally marks; for picture graphs, read what is a pictograph. For the textbook’s questions, see the Chapter 4 NCERT solutions; for the whole chapter, see the Chapter 4 notes.
Practice
-
With a scale of 1 unit length = 10 runs, how long is the bar for 90 runs?
Show answer
Answer: (a) 9 units
-
A bar of 6 units shows 24 tickets. The scale is:
Show answer
Answer: (b) 1 unit = 4 tickets
-
Which is NOT a rule for bar graphs?
Show answer
Answer: (d) Longer bars are wider
-
Imran's family spends ₹3,000 on rent. With 1 unit = ₹200, how long is the bar?
Show answer
Answer: 3,000 ÷ 200 = 15 units.
-
Why do we choose a scale like 1 unit = 10 crores for India's population?
Show answer
Answer: The numbers are huge; drawing 1 unit per person is impossible. A scale of 10 crores per unit makes the bars a size that fits on paper.
Questions students ask
What is a bar graph?
A graph of equally spaced bars of equal width, where the length or height of each bar shows the value of a category. It lets us compare values at a glance.
How do you choose the scale of a bar graph?
Look at the smallest and largest values and pick a round number for one unit length, such as 1, 5, 10, 100 or 200, so that the longest bar fits nicely on the paper. Mark the scale from zero.
Should bars be vertical or horizontal?
Either is correct, but vertical bars (a column graph) suit things measured upwards, like heights of mountains, and horizontal bars suit lengths along the ground, like river lengths.
Stuck on a question?
Take a photo and Lagnever AI explains it step by step. Try it for 7 days for ₹2.
Get it on Google Play Open in browser
For parents: after the trial, the plan renews monthly by UPI or card autopay. You can cancel anytime in the app.