What is a pictograph?
Answer in short
A pictograph shows data using pictures or symbols instead of numbers, so we can compare at a glance. Its key tells what one symbol stands for, such as one symbol = 10 children. When a symbol stands for many items, half a symbol shows half that number. Values that are not multiples of the key are hard to show exactly.
Stuck on a question? Take a photo and Lagnever AI explains it step by step. Try it for 7 days for ₹2. Get it on Google Play
Pictures for data
A pictograph shows data through pictures or symbols of objects, without writing numbers. In the book’s first example, smiley faces show how students travel to school: 11 come by school bus, 7 walk, 5 take a public bus, 4 come by private car and 3 by cycle. A glance shows that the school bus is the most common and the cycle the least.
The key
Every pictograph needs a key (also called the scale) that says what one symbol stands for. In the travel example, one smiley = 1 student. In Nand Kishor’s pictograph about sleep, one symbol = 10 children:
- Always slept at least 9 hours: 5 symbols, so 5 × 10 = 50 children.
- Sometimes: 2 full symbols and a half, so 20 + 5 = 25 children.
- Never: 4 symbols, so 40 children always slept less than 9 hours.
Reading a pictograph
To read a pictograph, count the symbols in a row and multiply by the key, adding half the key for each half symbol. In a pictograph where one symbol = 4 girls, a row with 4 symbols and a half shows 4 × 4 + 2 = 18 girls. Comparing rows is easy: more symbols mean more items.
Drawing a pictograph
Lakhanpal recorded how many students were absent in each class: 3, 5, 4, 2, 0, 1, 5 and 7. He drew one symbol for each student. But when Jarina and Sangita showed how many were present (20 to 35 per class), one symbol per student would mean drawing about 200 symbols. So they chose bigger keys:
- Jarina: one symbol = 5 students, so 35 needs 7 symbols.
- Sangita: one symbol = 10 students, with half a symbol for 5, so 25 is two and a half symbols.
Choosing a key that fits the numbers saves time and space.
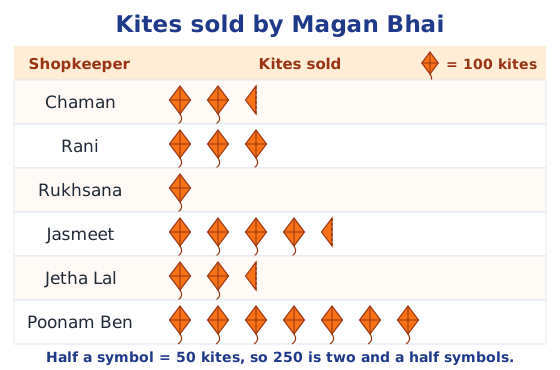
With one kite = 100 kites, Rani’s 300 kites need 3 symbols and Jasmeet’s 450 need four and a half. Poonam Ben bought 700, more than double Rani’s 300, since 2 × 300 = 600.
Choosing a good key
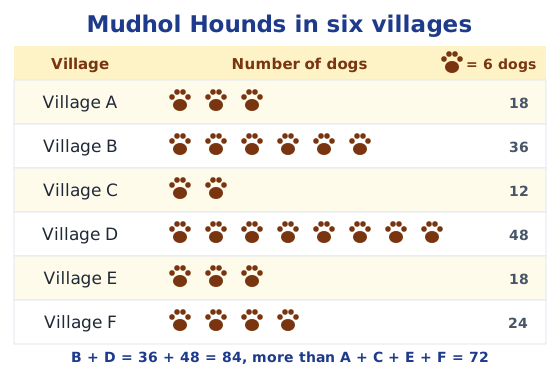
When all the numbers share a factor, use it as the key. The numbers of Mudhol Hounds in six villages, 18, 36, 12, 48, 18 and 24, are all multiples of 6, so one symbol = 6 dogs shows each village with whole symbols.
Limits of pictographs
What if a class has 33 or 27 students and one symbol = 10? 33 is three symbols and 3 more, and 27 is two and a half symbols and 2 more. Those extra 3 or 2 cannot be shown exactly with whole or half symbols. Pictographs also take long to draw when there is a lot of data. In such cases, a bar graph is usually better: see how to draw a bar graph.
Steps for a pictograph
- Write the categories in a column (or row).
- Choose a simple symbol and a key that suits the numbers.
- Draw the right number of symbols, using half symbols where needed.
- Write the key and a title.
To organise data before drawing it, read tally marks. For the textbook’s questions, see the Chapter 4 NCERT solutions; for the whole chapter, see the Chapter 4 notes.
Practice
-
One symbol = 10 children. How many children do 4 symbols show?
Show answer
Answer: (c) 40
-
One kite symbol = 100 kites. How many symbols show 450 kites?
Show answer
Answer: (b) 4 and a half
-
The dog numbers 18, 36, 12, 48, 18 and 24 are all multiples of:
Show answer
Answer: (b) 6
-
In a pictograph with one symbol = 4 girls, a class shows 2 and a half symbols. How many girls is that?
Show answer
Answer: 2 × 4 + 2 = 10 girls, since half a symbol stands for 2.
-
Why is it hard to show 33 students when one symbol = 10 and half a symbol = 5?
Show answer
Answer: 33 = 30 + 3. Three full symbols show 30, but 3 is not a whole or half symbol, so the extra 3 cannot be shown exactly.
Questions students ask
What is a pictograph?
A way of showing data with pictures or symbols of objects. Each symbol stands for a fixed number of items, given by the key, so we can understand and compare the data with a quick glance.
What is the key of a pictograph?
The statement of what one symbol represents, such as one symbol = 1 student or one symbol = 5 students. It must always be written, or the pictograph cannot be read.
What are the limits of a pictograph?
It takes time to draw when the data is large, and values that are not multiples of the key, such as 33 or 27 with a key of 10, cannot be shown exactly. Then a bar graph is often better.
Stuck on a question?
Take a photo and Lagnever AI explains it step by step. Try it for 7 days for ₹2.
Get it on Google Play Open in browser
For parents: after the trial, the plan renews monthly by UPI or card autopay. You can cancel anytime in the app.