Class 6 Maths Chapter 4: Data Handling and Presentation Notes
This chapter in five lines
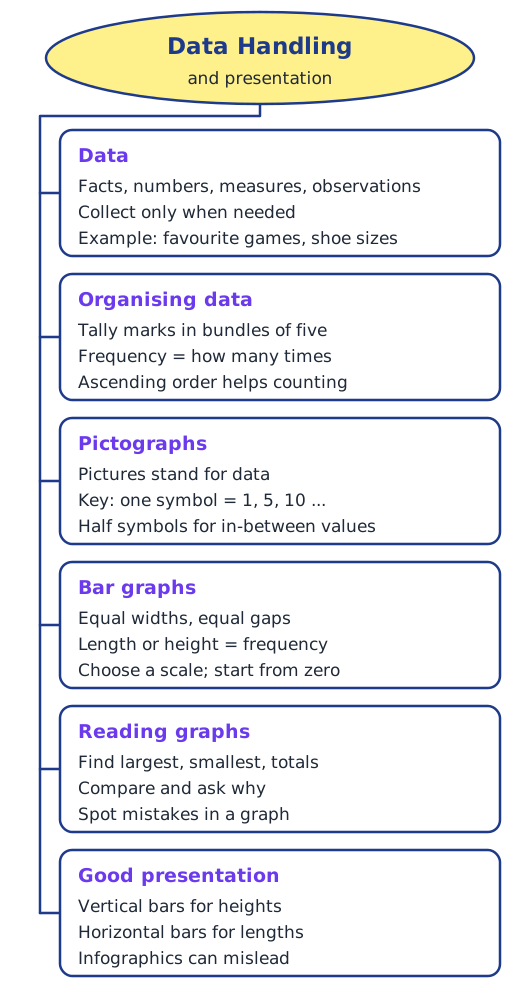
Data is any collection of facts, numbers, measures or observations that gives information. We organise data in tables using tally marks, and the count for each value is its frequency. Data can be shown as a pictograph, where pictures stand for numbers according to a key, or as a bar graph, where bars of equal width have lengths that match the frequencies on a chosen scale starting from zero. Good presentations are clear and attractive, but fancy infographics can mislead.
What is data?
Ask your classmates their favourite colours and you get a list of colours; weigh every student and you get a list of weights. Any collection of facts, numbers, measures, observations or other descriptions of things that conveys information about them is called data. We live in an age of information, and this chapter is about displaying data clearly and drawing correct conclusions from it.
Not every question needs data collection. ‘What is the most popular TV show in my class?’ needs data; ‘What is the capital of India?’ does not.
Collecting and organising data
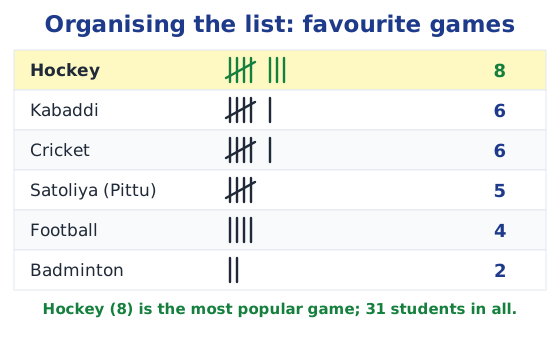
Navya and Naresh want the most popular game in their class. They ask every student and write a list of 31 names and games, but a list alone does not show the answer. Organising it in a table with tally marks does: one stroke for each student, with every fifth stroke crossing the first four. The count for each game is its frequency. Hockey, with 8, is the most popular. Read more in tally marks.
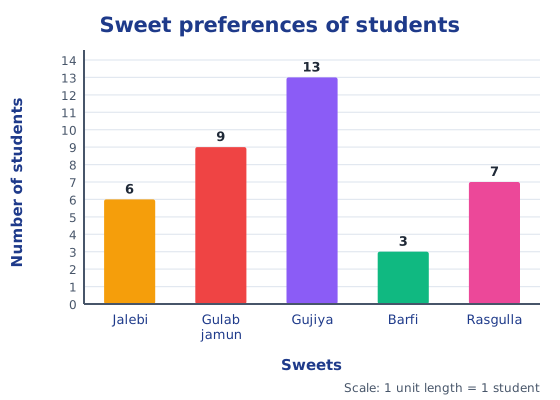
Shri Nilesh uses tally marks to find how many children want each sweet: jalebi 6, gulab jamun 9, gujiya 13, barfi 3 and rasgulla 7. Sushri Sandhya arranges her students’ shoe sizes in ascending order, which makes it easy to see that the largest size is 7, the smallest 3, and that 10 students wear size 5.
Pictographs
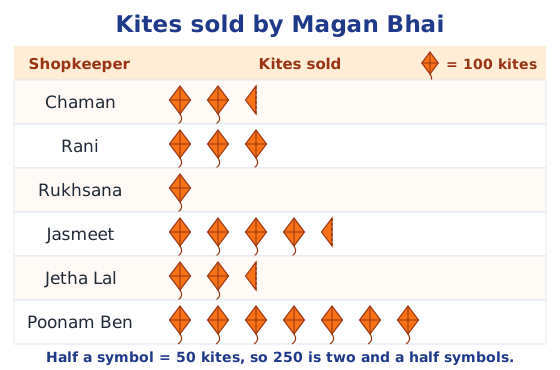
A pictograph shows data with pictures or symbols, so you can compare at a glance. The key says what one symbol stands for: one smiley = 1 student, or one symbol = 10 children. When the numbers are large, one symbol can stand for many items, and half a symbol can show half that number. Values such as 33 or 27, which are not multiples of the key, are hard to show exactly. Read more in what is a pictograph.
Bar graphs
When data is large, drawing pictures takes too long. A bar graph uses bars of equal width with equal gaps, and the length or height of each bar gives the value. Lakhanpal’s bar graph of absent students shows at a glance that Class 8 had the most absentees and Class 5 none. A traffic study in Delhi shows the busiest hour, 7 to 8 a.m., with 1,200 vehicles. The population of India rose from 36 crore in 1951 to 102 crore in 2001, a rise of 66 crore in 50 years.
Drawing a bar graph
- Draw a horizontal line and a vertical line.
- Write the categories along one line, equally spaced, and the values along the other.
- Choose a scale: how many items one unit length stands for, so the graph fits; mark it from zero.
- Draw bars of equal width with equal gaps, each as long as its value on the scale.
For Shri Nilesh’s sweets, 1 unit = 1 student works; for Smriti’s runs (0 to 100), 1 unit = 10 runs; for Imran’s family expenses, 1 unit = ₹200, so ₹3,400 for food needs 17 units. Read more in how to draw a bar graph.
Presenting data well
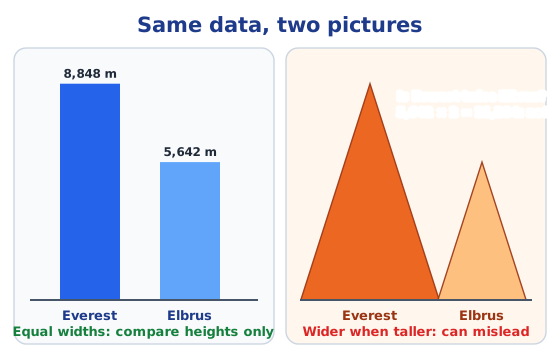
Heights measured upwards, such as the tallest mountain on each continent, are shown most naturally with vertical bars, also called a column graph; lengths along the ground, such as river lengths, with horizontal bars. Infographics add artistic pictures to graphs to attract attention, but they can mislead: if taller mountains are also drawn wider, they look bigger than they are. Everest (8,848 m) is not twice as tall as Elbrus (5,642 m), since 5,642 × 2 = 11,284.
Answers to every question are in the NCERT solutions for Chapter 4.
Key terms
| Term | Meaning |
|---|---|
| Data | Any collection of facts, numbers, measures, observations or other descriptions of things that gives information about them. |
| Tally marks | Strokes used to count, one for each item; every fifth stroke is drawn across the previous four to make a bundle of five. |
| Frequency | The number of times a value, measure or observation occurs in the data, such as 6 students choosing jalebi. |
| Frequency table | A table that lists each value or category with its tally marks and frequency. |
| Pictograph | A way to show data using pictures or symbols, where each symbol stands for a fixed number of items. |
| Key (scale) of a pictograph | The statement of what one symbol stands for, such as one symbol = 5 students; half a symbol then stands for half that number. |
| Bar graph | A graph of equally spaced bars of equal width, whose lengths or heights show the frequencies of different categories. |
| Scale of a bar graph | How many items one unit length of a bar stands for, such as 1 unit length = 10 runs; the markings start from zero. |
| Column graph | A bar graph with vertical bars, useful for things measured upwards, such as heights of mountains. |
| Infographic | A data picture decorated with artistic images to attract attention; it can be appealing but sometimes misleading. |
Topics in this chapter
Practice
-
In tally marks, how is the number 7 shown?
Show answer
Answer: (b) A bundle of five and two strokes
-
In a pictograph, one symbol = 10 children. Two and a half symbols show:
Show answer
Answer: (b) 25 children
-
In a bar graph, all bars must have:
Show answer
Answer: (b) equal widths and equal gaps
-
The scale of a bar graph is 1 unit length = 200 rupees. A bar of 17 units shows:
Show answer
Answer: (b) ₹3,400
-
Which kind of bar graph suits the heights of mountains?
Show answer
Answer: (b) Vertical bars (columns)
Questions students ask
What are the main topics of Class 6 Maths Chapter 4?
What data is, collecting and organising data with tally marks and frequency tables, pictographs and their keys, reading and drawing bar graphs with a suitable scale, vertical and horizontal bars, and infographics and how they can mislead.
Is Data Handling and Presentation in the new Ganita Prakash book?
Yes. Data Handling and Presentation is Chapter 4 of Ganita Prakash, the Class 6 Maths textbook (Reprint 2026-27). It comes after Chapter 3, Number Play.
How many questions does Chapter 4 have?
Each section has its own Figure it Out; the longest one, after drawing bar graphs, has 11 questions. Our NCERT solutions page answers every question, with the graphs and pictographs drawn.
Stuck on a question?
Take a photo and Lagnever AI explains it step by step. Try it for 7 days for ₹2.
Get it on Google Play Open in browser
For parents: after the trial, the plan renews monthly by UPI or card autopay. You can cancel anytime in the app.