
Tally marks
Answer in short
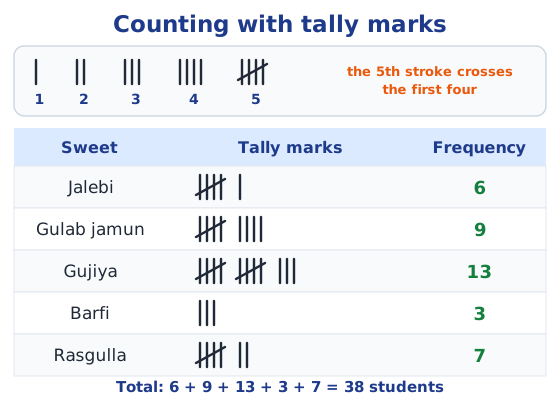
Tally marks are strokes used to count data quickly: one stroke for each item, and every fifth stroke is drawn across the first four to make a bundle of five. The count for each value is its frequency. For example, 13 is shown as two bundles of five and three more strokes, so the counts are easy to read.
Stuck on a question? Take a photo and Lagnever AI explains it step by step. Try it for 7 days for ₹2. Get it on Google Play
Why organise data?
Navya and Naresh ask every student in their class to name their favourite game and write down a list of 31 names and games. Navya says she can now find the most popular game, but her friends cannot see it in the long list. Data is far more useful once it is organised.
How tally marks work
Tally marks are short strokes for counting. Go through the data one item at a time and draw a stroke for each item against its category. After four upright strokes, draw the fifth stroke across the first four. This makes bundles of five that you can count quickly: two bundles and three strokes make 13.
Frequency and frequency tables
The number of times a value occurs is its frequency. A frequency table lists each value with its tally marks and frequency. Shri Nilesh wanted to buy sweets for his class, so he wrote the names of the sweets on the board and put a tally mark for each child’s choice. His table showed jalebi 6, gulab jamun 9, gujiya 13, barfi 3 and rasgulla 7, so he knew exactly how many of each to buy: 38 sweets in all.
Notice what the table cannot do: it tells how many children want each sweet, but not which child wants which. To hand out the sweets, he would also need a list of names next to each choice.
Organising Navya’s list
Using tally marks on Navya and Naresh’s list gives:
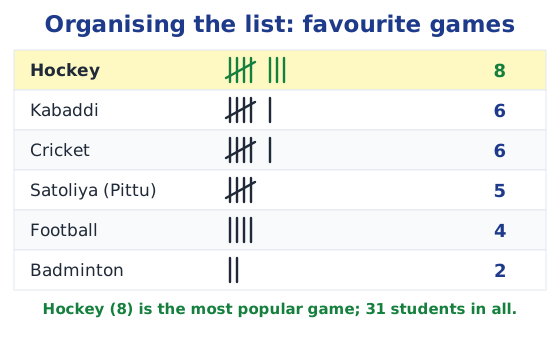
Hockey, with a frequency of 8, is the most popular game. Kabaddi and cricket tie with 6 each. The frequencies add up to 31, the number of students, which is a good check that nobody was missed.
Arranging data in order
Sometimes it helps to arrange data in ascending order first. Sushri Sandhya’s 27 students wear shoe sizes from 3 to 7. Sorted, the sizes are three 3s, nine 4s, ten 5s, four 6s and one 7. Now it is easy to see that the largest size is 7, the smallest is 3, 10 students wear size 5, and 15 students wear sizes larger than 4. A tally table with the sizes 3 to 7 would give the same counts.
Try it yourself
- Letters in a newspaper: count how many times the letters c, e, i, r and x appear in a short English news item. Almost everyone finds the order, from fewest to most, to be x, c, r, i, e, because e is the most common letter in English and x one of the rarest.
- Trees on your way to school: tally each kind of tree you pass, then find which is most and least common.
- Rolling a die 30 times: tally each result and look for the number that came up most often.
Tips for tallying
- Prepare the table with all the categories before you start.
- Strike off or tick each item as you count it.
- Keep each bundle of five neat, with the crossing stroke clearly through the four.
- At the end, check that the frequencies add up to the total.
Organised data can then be drawn as a picture: see what is a pictograph and how to draw a bar graph. For the textbook’s questions, see the Chapter 4 NCERT solutions; for the whole chapter, see the Chapter 4 notes.
Practice
-
How many does a bundle of tally marks with one stroke across stand for?
Show answer
Answer: (b) 5
-
Two bundles of five and three more strokes stand for:
Show answer
Answer: (c) 13
-
The number of times a value occurs in data is called its:
Show answer
Answer: (b) frequency
-
Draw tally marks for 12.
Show answer
Answer: Two bundles of five (four upright strokes with a fifth across them, twice) and two more upright strokes.
-
In a class, 31 students named their favourite game: hockey 8, kabaddi 6, cricket 6, satoliya 5, football 4. How many chose badminton?
Show answer
Answer: 31 − (8 + 6 + 6 + 5 + 4) = 31 − 29 = 2 students.
Questions students ask
What are tally marks?
Short strokes used to count things as you go through data: one stroke for each item, with every fifth stroke drawn across the previous four. The bundles of five make the total easy to count.
Why do we use tally marks?
They let us count many items quickly and without mistakes while reading a list or watching events, such as vehicles passing a road, and then turn the counts into a frequency table.
What is a frequency table?
A table with each value or category, its tally marks and its frequency, the number of times it occurs. For example: jalebi 6, gulab jamun 9, gujiya 13, barfi 3, rasgulla 7.
Stuck on a question?
Take a photo and Lagnever AI explains it step by step. Try it for 7 days for ₹2.
Get it on Google Play Open in browser
For parents: after the trial, the plan renews monthly by UPI or card autopay. You can cancel anytime in the app.